On this page
- The 2020 ranking: top 40 of 132
- The top 15 country by country
- Pillar leaders in GTCI 2020
- What changed since the 2019 edition
- Regions and income groups
- Talent champions, movers, limpers and laggards
- Global talent in the age of artificial intelligence
- How the 2020 model differs from other editions
- The cities ranking published with GTCI 2020
- INSEAD, the business school behind the index
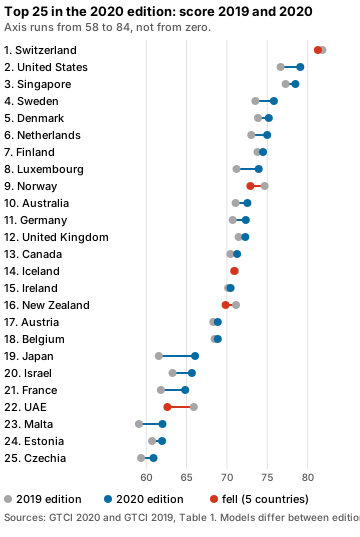
The 2020 edition is the seventh in the series1. Its theme was artificial intelligence, and its ranking carried one headline: the United States rose to second place, its highest position in the index so far, and Singapore slipped to third1. Switzerland stayed first, as it has in every edition since the index began in 20131. This page gives the table first, then the top 15 country by country, the leaders on each pillar, the moves since the 2019 edition, the regional and income picture, what the 2020 edition concluded about talent and AI, and the model changes that limit comparison with other years.
The 2020 ranking: top 40 of 132
Table 1 of the GTCI 2020 report lists every country with its score, income group and region1. Rows 1 to 40 are copied below with the report’s own figures1. The index covers 132 countries, up from 125 in 2019, representing 97% of the world’s GDP and 94% of its population1.
| Rank | Country | Score | Region | Income group |
|---|---|---|---|---|
| 1 | Switzerland | 81.26 | Europe | High1 |
| 2 | United States of America | 79.09 | Northern America | High1 |
| 3 | Singapore | 78.48 | East and Southeast Asia, Oceania | High1 |
| 4 | Sweden | 75.82 | Europe | High1 |
| 5 | Denmark | 75.18 | Europe | High1 |
| 6 | Netherlands | 74.99 | Europe | High1 |
| 7 | Finland | 74.47 | Europe | High1 |
| 8 | Luxembourg | 73.94 | Europe | High1 |
| 9 | Norway | 72.91 | Europe | High1 |
| 10 | Australia | 72.53 | East and Southeast Asia, Oceania | High1 |
| 11 | Germany | 72.34 | Europe | High1 |
| 12 | United Kingdom | 72.27 | Europe | High1 |
| 13 | Canada | 71.26 | Northern America | High1 |
| 14 | Iceland | 70.90 | Europe | High1 |
| 15 | Ireland | 70.45 | Europe | High1 |
| 16 | New Zealand | 69.84 | East and Southeast Asia, Oceania | High1 |
| 17 | Austria | 68.87 | Europe | High1 |
| 18 | Belgium | 68.87 | Europe | High1 |
| 19 | Japan | 66.06 | East and Southeast Asia, Oceania | High1 |
| 20 | Israel | 65.66 | Northern Africa and Western Asia | High1 |
| 21 | France | 64.83 | Europe | High1 |
| 22 | United Arab Emirates | 62.63 | Northern Africa and Western Asia | High1 |
| 23 | Malta | 62.02 | Europe | High1 |
| 24 | Estonia | 61.97 | Europe | High1 |
| 25 | Czech Republic | 60.91 | Europe | High1 |
| 26 | Malaysia | 60.04 | East and Southeast Asia, Oceania | Upper-middle1 |
| 27 | Korea, Rep. | 59.59 | East and Southeast Asia, Oceania | High1 |
| 28 | Portugal | 57.80 | Europe | High1 |
| 29 | Qatar | 57.74 | Northern Africa and Western Asia | High1 |
| 30 | Cyprus | 57.47 | Northern Africa and Western Asia | High1 |
| 31 | Slovenia | 57.42 | Europe | High1 |
| 32 | Spain | 55.70 | Europe | High1 |
| 33 | Latvia | 54.40 | Europe | High1 |
| 34 | Chile | 53.96 | Latin America and the Caribbean | High1 |
| 35 | Lithuania | 53.32 | Europe | High1 |
| 36 | Italy | 52.91 | Europe | High1 |
| 37 | Costa Rica | 52.29 | Latin America and the Caribbean | Upper-middle1 |
| 38 | Brunei Darussalam | 52.17 | East and Southeast Asia, Oceania | High1 |
| 39 | Slovakia | 52.08 | Europe | High1 |
| 40 | Saudi Arabia | 51.48 | Northern Africa and Western Asia | High1 |
European countries took 17 of the top 25 places1. The non-European countries in that group are the United States and Singapore, then Australia, Canada, New Zealand, Japan, Israel and the United Arab Emirates1. Austria and Belgium print the same score, 68.87, at 17th and 18th1. Past the top 25 the table opens up: Malaysia is 26th and the highest-ranked country outside the high-income group, South Korea is 27th, Portugal 28th and Qatar 29th1. Chile is 34th, Costa Rica 37th and China 42nd1.
Worked example (our arithmetic). Where is the ranking steep? Six comparisons answer it. Each line subtracts one score of the table above from another1.
| Stretch | Calculation | Gap |
|---|---|---|
| Rank 1 to rank 10 | 81.26 − 72.53 | 8.73 points1 |
| Rank 10 to rank 25 | 72.53 − 60.91 | 11.62 points1 |
| Rank 25 to rank 40 | 60.91 − 51.48 | 9.43 points1 |
| Rank 1 to rank 25 | 81.26 − 60.91 | 20.35 points1 |
| Rank 1 to rank 3 | 81.26 − 78.48 | 2.78 points1 |
| Rank 2 to rank 3 | 79.09 − 78.48 | 0.61 points1 |
The middle stretch, 10th to 25th, is the longest, so a country there needs a larger score gain to move a given number of places than a country near the top. The two bottom rows put the headline in proportion: the United States took second place by 0.61 points over Singapore, while Switzerland leads third place by 2.781. Little separates the United States and Singapore1.
The top 15 country by country
The top group is stable from year to year1. All countries but one in the 2020 top 15 were also in the 2019 top 15, Ireland (15th, up from 16th) is the newcomer and New Zealand (16th, down from 11th) dropped out1. Top countries typically do well on every pillar1. Four countries are in the top 15 on five of the six pillars and five countries on four of them1. The table lists, for each of the 15, the pillar where the report ranks it best and the one it flags for improvement.
| Rank | Country | Strongest pillar | Pillar flagged for improvement |
|---|---|---|---|
| 1 | Switzerland | Retain, 1st1 | Attract, 6th1 |
| 2 | United States | Grow and Vocational and Technical Skills, both 1st1 | Attract, 11th1 |
| 3 | Singapore | Enable, Attract and Global Knowledge Skills, all 1st1 | Retain, 24th1 |
| 4 | Sweden | Enable, 4th1 | Attract, 10th1 |
| 5 | Denmark | Retain, 3rd1 | Attract, 14th1 |
| 6 | Netherlands | Grow, 3rd1 | Global Knowledge Skills, 16th1 |
| 7 | Finland | Grow and Vocational and Technical Skills, both 4th1 | Attract, 13th1 |
| 8 | Luxembourg | Attract, 2nd1 | Grow, 19th1 |
| 9 | Norway | Retain, 2nd1 | Attract, 16th1 |
| 10 | Australia | Attract, 7th1 | Vocational and Technical Skills, 20th1 |
| 11 | Germany | Vocational and Technical Skills, 3rd1 | Global Knowledge Skills, 23rd1 |
| 12 | United Kingdom | Global Knowledge Skills, 3rd1 | Vocational and Technical Skills, 24th1 |
| 13 | Canada | Attract, 8th1 | Retain, 20th1 |
| 14 | Iceland | Retain, 6th1 | Attract, 18th1 |
| 15 | Ireland | Attract, 9th1 | Enable, 21st1 |
The shape of the table is the finding. Attract is the pillar flagged most often, for seven of the 151. It has two halves: luring foreign business and creative people, and removing barriers to the talent pool for groups at home such as women and people from underprivileged backgrounds1. Finland, for example, ranks 32nd on External Openness and 2nd on Internal Openness1. Norway shows the same split, 4th on Internal Openness and 31st on External1.
Switzerland (1st) has no pillar below 6th, leads the world in the Lifelong Learning and Sustainability sub-pillars, and ranks outside the top 10 in only one of 14 sub-pillars, Internal Openness (16th), where it scores lower on gender equality and on tolerance of minorities and immigrants1. It is in the top 10 on 42 variables and first on 14 of them1. The United States (2nd) is in the top 3 on four of the six pillars and first in Access to Growth Opportunities1. Its first place in Employability, the match between skills and what the economy needs, drives its Vocational and Technical Skills result1.
Singapore (3rd) is the highest-ranked country in three pillars, more top spots than anyone, and first in Regulatory Landscape, Business and Labour Landscape, External Openness and High-Level Skills1. Its weak side is keeping talent: Retain is 24th, an underwhelming result with room to improve in both sub-pillars1. Sweden (4th) claims no top spot on any single indicator, but it ranks above the median on every one1. Denmark (5th) is the global leader in Talent Impact, the entrepreneurship and innovation sub-pillar, and its only pillar outside the top 10 is Attract1.
The sub-pillar detail below the top five fills in the rest. Luxembourg (8th) gets its Sustainability sub-pillar up to 2nd on a world-class pension system and social protection, while Formal Education (60th) is the area to strengthen1. Australia (10th) tops the Formal Education sub-pillar on tertiary education indicators1. Germany (11th) is first in Mid-Level Skills, the workforce trained through vocational routes1. The United Kingdom (12th) is third in Global Knowledge Skills yet 31st in Internal Openness1. Iceland (14th) leads the world on Internal Openness and is 54th on External Openness1. Ireland (15th) is particularly successful at attracting overseas business1.
For how each pillar is built, see the pillar guide. The rankings hub links the other editions.
Pillar leaders in GTCI 2020
The overall score is the simple average of six pillar scores, four Input pillars and two Output pillars1. Table A1 of the report names the three highest scorers on each pillar1.
| Pillar | 1st | 2nd | 3rd |
|---|---|---|---|
| Enable | Singapore | Switzerland | United States1 |
| Attract | Singapore | Luxembourg | United Arab Emirates1 |
| Grow | United States | Switzerland | Netherlands1 |
| Retain | Switzerland | Norway | Denmark1 |
| Vocational and Technical (VT) Skills | United States | Switzerland | Germany1 |
| Global Knowledge (GK) Skills | Singapore | United States | United Kingdom1 |
Singapore takes three first places and the United States two, while Switzerland leads only Retain and finishes second on three others1. Switzerland’s first place therefore rests on consistency more than on pillar wins: its lowest rank on any pillar is 6th1. Countries outside the top 15 also lead specific pillars. New Zealand is fifth for attracting talent, Austria fifth for retaining it and eighth on Vocational and Technical Skills, Japan eighth on Enable and Israel sixth on Global Knowledge Skills1. The United Arab Emirates and Qatar are third and fourth in the world for attracting talent1.
The Output pillar labelled Global Knowledge Skills here was relabelled Generalist Adaptive Skills in the 2025 edition, so a pillar rank under that name in a recent edition is not guaranteed to be like for like4. The 2025 results page shows the pillars after that change.
What changed since the 2019 edition
The top 25 of 2020 holds nearly the same countries as in 2019. Malta (rising from 26th to 23rd) and Qatar (falling from 24th to 29th) are the exceptions1. At the very top, Switzerland stayed first although its score fell from 81.82 to 81.262,1. The United States went from third to second as its score rose from 76.64 to 79.09, and Singapore went from second to third, 77.27 to 78.482,1. Singapore had been runner-up since the index began, and the United States has trended upward since the launch of the GTCI1.
Worked example (our arithmetic). The lead of first place over the runner-up shows how much closer the top moved. Each lead subtracts the second-place score from Switzerland’s score in the same edition2,1.
| Edition | First place | Runner-up | Lead |
|---|---|---|---|
| 2019 | Switzerland, 81.822 | Singapore, 77.272 | 81.82 − 77.27 = 4.55 points |
| 2020 | Switzerland, 81.261 | United States, 79.091 | 81.26 − 79.09 = 2.17 points |
Switzerland’s lead over second place fell by more than half in one edition. The next table puts three editions next to each other, one row per country. The 2021 column, from the GTCI 2021 report, is shown for context only3.
Worked example (our arithmetic). Each change subtracts the 2020 rank from the 2019 rank, both read from Table 1 of the GTCI 2019 report and of the 2020 report2,1. A positive change is a climb.
| Country | 2019 rank | 2020 rank | 2021 rank | Change 2019 to 2020 |
|---|---|---|---|---|
| Switzerland | 12 | 11 | 13 | no change2,1 |
| United States of America | 32 | 21 | 33 | up 12,1 |
| Singapore | 22 | 31 | 23 | down 12,1 |
| Sweden | 72 | 41 | 53 | up 32,1 |
| Denmark | 52 | 51 | 43 | no change2,1 |
| Netherlands | 82 | 61 | 63 | up 22,1 |
| Finland | 62 | 71 | 73 | down 12,1 |
| Luxembourg | 102 | 81 | 83 | up 22,1 |
| Norway | 42 | 91 | 93 | down 52,1 |
| Australia | 122 | 101 | 113 | up 22,1 |
| Germany | 142 | 111 | 143 | up 32,1 |
| United Kingdom | 92 | 121 | 123 | down 32,1 |
| Canada | 152 | 131 | 133 | up 22,1 |
| Iceland | 132 | 141 | 103 | down 12,1 |
| Ireland | 162 | 151 | 163 | up 12,1 |
| New Zealand | 112 | 161 | 153 | down 52,1 |
| Austria | 182 | 171 | 183 | up 12,1 |
| Belgium | 172 | 181 | 173 | down 12,1 |
| Japan | 222 | 191 | 203 | up 32,1 |
| Israel | 202 | 201 | 213 | no change2,1 |
| France | 212 | 211 | 193 | no change2,1 |
| United Arab Emirates | 192 | 221 | 253 | down 32,1 |
| Malta | 262 | 231 | 233 | up 32,1 |
| Estonia | 232 | 241 | 223 | down 12,1 |
| Czech Republic | 252 | 251 | 243 | no change2,1 |
Of these 25 countries, 11 rose, 9 fell and 5 kept the same rank between 2019 and 20202,1. The biggest falls were five places each for Norway (4th to 9th) and New Zealand (11th to 16th), and the biggest climbs were three places each for Sweden, Germany, Japan and Malta2,1. Qatar, 24th in 2019, is 29th in 2020 and so is not among the 25 in the table2,1.
Rank and score tell different stories. Scores rose for 20 of the 25 countries and fell for five: Switzerland, Norway, Iceland, New Zealand and the United Arab Emirates2,1. Norway’s rank drop of five places came with a score drop from 74.67 to 72.91, while Germany gained three places on a rise from 70.72 to 72.342,1. The model also changed between the two editions, and a score change is not a pure measure of performance. The section on the model below lists what moved.
Regions and income groups
The 2020 index has 132 countries: 48 high-income, 36 upper-middle-income, 32 lower-middle-income and 16 low-income1. By region, it has 10 from Central and Southern Asia, 15 from Eastern, Southeastern Asia and Oceania, 38 from Europe, 20 from Latin America and the Caribbean, 18 from Northern Africa and Western Asia, 2 from Northern America and 29 from Sub-Saharan Africa1. Eight countries are new since the 2019 edition, and Lebanon dropped out for lack of data1.
Income and talent competitiveness move together. All high-income countries rank in the upper half, and the lowest-ranked high-income country has a higher score than the median upper-middle-income country1. The top quartile of 33 countries contains only high-income countries, with one exception: Malaysia, 26th, the top-ranked upper-middle-income country, followed by Costa Rica (37th) and China (42nd)1. Of the lower-middle-income countries, only the Philippines (46th), Indonesia (65th) and Ukraine reach the third quartile1. The top three low-income countries, Tajikistan (84th), Gambia (85th) and Rwanda (93rd), are the only ones above the bottom quartile1. In all, 43 of the 48 high-income countries are in the top 50, and the five outside it are Uruguay (51st), Hungary (52nd), Croatia (59th), Panama (62nd) and Kuwait (63rd)1.
The gap shows on every pillar. The average high-income country beats the average upper-middle-income country by about 18 points on Vocational and Technical Skills, Attract and Grow, and by about 24 on Retain1. Attract is the exception to the pattern: it is the one pillar where little separates the three lower income groups, and low-income countries even outscore lower-middle-income countries at some percentiles1.
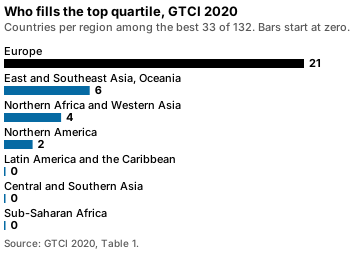
Europe supplies 21 of the top 33 countries, and 13 more European countries sit in the third quartile1. Latin America and the Caribbean has no country in the top quartile, although Chile, 34th, is just outside it1. Central and Southern Asia has only one country in the upper half, Kazakhstan, 54th1. Sub-Saharan Africa is the worst-performing region: 20 of its 29 countries are in the bottom quartile, and Mauritius, 49th, is the only one in the third quartile1.
| Group | Best three countries |
|---|---|
| Central and Southern Asia | Kazakhstan, India, Sri Lanka1 |
| Latin America and the Caribbean | Chile, Costa Rica, Trinidad and Tobago1 |
| Sub-Saharan Africa | Mauritius, South Africa, Botswana1 |
| Low-income countries | Tajikistan, Gambia, Rwanda1 |
Talent champions, movers, limpers and laggards
The 2020 report repeats the time-series method it introduced the year before. It compares GTCI performance over two three-year periods, 2015 to 2017 against 2018 to 20201. A country is a talent champion if its score improved over the two periods and is high in the 2020 index, a talent mover if it improved but scores low, a talent limper if it worsened but still scores high, and a talent laggard if it worsened and scores low1. The dividing line for a high score is the average 2020 score of the countries in the analysis, 49.91.
Most high-income countries are champions, among them the top three, whose average scores over the two periods grew by close to 10% or more1. Malaysia and Costa Rica are the two upper-middle-income champions, while most upper-middle-income countries are laggards1. Indonesia is the pacesetter among movers, and Ghana and India are two more lower-middle-income movers1. Four high-income countries are laggards, Croatia, Hungary, Panama and Poland, and Hungary had the worst drop in overall score, almost 14%1. El Salvador and Nicaragua are laggards with average scores more than 20% lower in 2018 to 20201. Seven of the top 10 countries in 2015 to 2017 were also in the top 10 in 2018 to 2020, the highest share of any 10-country band1.
The gap between the talent champions and the rest is significant and appears to be increasing1. That is also the first of the six key messages, and it applies the same reading to AI talent, which is scarce and unequally distributed1.
Global talent in the age of artificial intelligence
The 2020 theme explains why this edition reads differently from the others. The report treats AI as a talent question: who has the skills to build it, who can work alongside it, and who will be left out1. Its key messages in short:
- The gap is widening. More than half of the population in the developing world lack basic digital skills, and the digital skills divide is broadening1.
- Emerging markets can leapfrog. The report cites China, Costa Rica and Malaysia as talent champions in their regions and Ghana and India as talent movers, and suggests Latin America could become a global delivery centre for AI applications1.
- Re-skilling is large. At all qualification levels workers will need training on adaptability, social intelligence, communication and problem-solving1.
- Cities compete for AI talent. Cities are striving to become AI hubs and attract relevant talents, in step with smart-city strategies1.
Two strands of context sit around those messages. In April 2018, 25 European countries signed a declaration of cooperation on artificial intelligence1. On the corporate side, the report quotes Kai-Fu Lee on seven companies that became the new giants of corporate AI research: Google, Facebook, Amazon, Microsoft, Baidu, Alibaba and Tencent1. For the same questions tested against labour-market data from the WEF, OECD and ILO, see the talent and technology story, the automation and jobs guide and the WEF Future of Jobs reference.
How the 2020 model differs from other editions
The 2020 model has 70 variables, up from 68 in 20191. The report lists four notable changes. Ease of hiring, Ease of redundancy and Gender earnings gap were dropped for weak explanatory power, and Business-government relations was dropped because it had not been updated since 20141. A new Technology Adoption component was created in the Business and Labour Landscape sub-pillar, with three variables: Technology utilisation, Investment in emerging technologies and Robot density1. New variables were added besides, among them Rule of law, Urbanisation, Unemployment with advanced education and Gender development gap1. The audit by the European Commission’s Joint Research Centre confirmed that the changes improved the model’s accuracy while keeping it solid and robust1.
| Edition | Countries | Variables |
|---|---|---|
| GTCI 2019 | 1251 | 681 |
| GTCI 2020 | 1321 | 701 |
| GTCI 2021 | 1343 | 683 |
| GTCI 2025 | 1354 | 774 |
Counts and variable lists differ in every row, so scores are best read inside one edition, with ranks as the only loose bridge between editions1,3,4. Robot density, new in 2020, was replaced in the 2021 model by firms with a website, one more reason to avoid chaining scores across years3. How the pillars are built and weighted is explained in the methodology page and the guide to what the index measures.
The cities ranking published with GTCI 2020
The 2020 report also carries a ranking of cities, the Global City Talent Competitiveness Index (GCTCI). Its fourth edition covers 155 cities in 75 economies, up from 114 cities in 64 economies the year before1. New York ranks first, ahead of London and Singapore, followed by San Francisco and Boston1. Only three of the top 10 cities were also there in 2019: New York, Boston and Paris1. The most striking case is Washington, DC, first in 2019 and 25th in 2020, a drop the report links partly to the model changes and a low number of foreign direct investment projects1. Shanghai (32nd) and Beijing (35th) put China into the top quartile for the first time1. The highest-ranked African cities, Casablanca (123rd), Rabat (129th) and Cape Town (134th), are in the bottom quartile1.
INSEAD, the business school behind the index
The 2020 report was edited by Bruno Lanvin and Felipe Monteiro1. Its copyright line names INSEAD, the Adecco Group and Google, and a disclaimer adds that the index methodology and rankings do not necessarily present the views of INSEAD, Adecco or Google1. In the report’s own partner profile, INSEAD calls itself one of the world’s leading and largest graduate business schools, with campuses in Europe (France), Asia (Singapore) and the Middle East (Abu Dhabi), 165 faculty members from 41 countries and more than 1,300 degree participants a year1. The Adecco Group’s profile in the same section gives more than 3.5 million careers enabled and operations in 60 countries1. Those are 2020 descriptions of the organisations, not a current profile. The editions page records which partners appear on each report.
Other editions: the GTCI 2019 ranking is the table before this one, the GTCI 2021 ranking the next, the 2017 results show the model three editions earlier, and the Switzerland and Singapore story follows the top two across the series.
Common questions
What is the Global Talent Competitiveness Index (GTCI)?
The GTCI is a composite index that, in its 2020 edition, scores 132 countries on the policies and practices that develop, attract and empower the human capital behind productivity and prosperity1. It averages six pillars, four on the Input side and two on the Output side1.
RelatedGTCI 2019 ranking: top 40 of 125 countries and scoresGTCI 2021 ranking: top 40 of 134 countries and scoresGTCI editions 2013 to 2023: themes, coverage, top three
Sources
- The Global Talent Competitiveness Index 2020: Global talent in the age of artificial intelligence · INSEAD, the Adecco Group and Google, GTCI 2020 · globaltalentcompetitivenessindex.org · checked October 22, 2026
- The Global Talent Competitiveness Index 2019: Entrepreneurial talent and global competitiveness · INSEAD, Adecco Group and Tata Communications, GTCI 2019 · globaltalentcompetitivenessindex.org · checked October 22, 2026
- The Global Talent Competitiveness Index 2021: Talent competitiveness in times of COVID-19 · INSEAD, Portulans Institute and Accenture, GTCI 2021 · globaltalentcompetitivenessindex.org · checked October 22, 2026
- Global Talent Competitiveness Index 2025: Talent and resilience · INSEAD and Portulans Institute, GTCI 2025 · portulansinstitute.org · checked October 22, 2026
- World Competitiveness Ranking (IMD World Competitiveness Center) · IMD business school, page seen 22 Oct 2026 · imd.org · checked October 22, 2026
Image credits (2)
Published . Rankings change with every edition: each figure names its edition year and each source shows the day it was checked. How we check facts · Report an error.