On this page
- The 2019 ranking: top 40 of 125
- How far ahead Switzerland was, edition by edition
- National talent competitiveness in 2019
- Pillar leaders in GTCI 2019
- What changed since the 2018 edition
- Regions and income groups
- Entrepreneurial talent, the 2019 theme
- A first look across two three-year periods
- The GTCI and the Global Competitiveness Index
- The 2019 model and its neighbours
- The cities ranking in the 2019 report
- Who produced the 2019 report
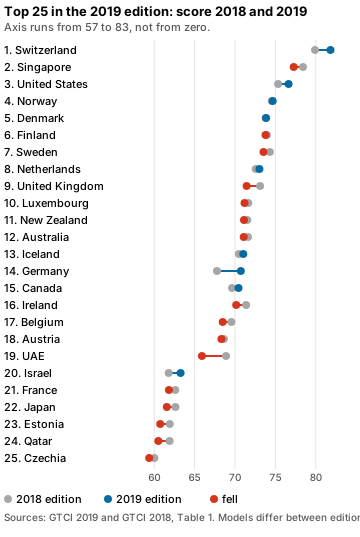
The sixth edition kept its top three: Switzerland, Singapore and the United States held the first three places for a second year in a row1. The list of countries in the top 25 was identical to the 2018 list1. The movement was lower down: Germany returned to the top 15 and Ireland left it1. The 2019 theme was entrepreneurial talent, and the report carried the series’ first comparison of two three-year periods1,3. Below you get the table, the top 15 country by country, the pillar leaders, the shifts against 2018 and 2020, the regional and income picture, and what the entrepreneurship theme added.
The 2019 ranking: top 40 of 125
Table 1 of the GTCI 2019 report gives every country a score, an income group and a region1. Forty rows are shown here, copied from that table1. Coverage grew from 119 to 125 countries, almost 98% of the world’s GDP and 93% of its population1.
| Rank | Country | Score | Region | Income group |
|---|---|---|---|---|
| 1 | Switzerland | 81.82 | Europe | High1 |
| 2 | Singapore | 77.27 | East and Southeast Asia, Oceania | High1 |
| 3 | United States of America | 76.64 | Northern America | High1 |
| 4 | Norway | 74.67 | Europe | High1 |
| 5 | Denmark | 73.85 | Europe | High1 |
| 6 | Finland | 73.78 | Europe | High1 |
| 7 | Sweden | 73.53 | Europe | High1 |
| 8 | Netherlands | 73.02 | Europe | High1 |
| 9 | United Kingdom | 71.44 | Europe | High1 |
| 10 | Luxembourg | 71.18 | Europe | High1 |
| 11 | New Zealand | 71.12 | East and Southeast Asia, Oceania | High1 |
| 12 | Australia | 71.08 | East and Southeast Asia, Oceania | High1 |
| 13 | Iceland | 71.03 | Europe | High1 |
| 14 | Germany | 70.72 | Europe | High1 |
| 15 | Canada | 70.43 | Northern America | High1 |
| 16 | Ireland | 70.15 | Europe | High1 |
| 17 | Belgium | 68.48 | Europe | High1 |
| 18 | Austria | 68.31 | Europe | High1 |
| 19 | United Arab Emirates | 65.90 | Northern Africa and Western Asia | High1 |
| 20 | Israel | 63.26 | Northern Africa and Western Asia | High1 |
| 21 | France | 61.82 | Europe | High1 |
| 22 | Japan | 61.56 | East and Southeast Asia, Oceania | High1 |
| 23 | Estonia | 60.74 | Europe | High1 |
| 24 | Qatar | 60.50 | Northern Africa and Western Asia | High1 |
| 25 | Czech Republic | 59.38 | Europe | High1 |
| 26 | Malta | 59.10 | Europe | High1 |
| 27 | Malaysia | 58.62 | East and Southeast Asia, Oceania | Upper-middle1 |
| 28 | Portugal | 55.66 | Europe | High1 |
| 29 | Slovenia | 54.44 | Europe | High1 |
| 30 | Korea, Rep. | 54.19 | East and Southeast Asia, Oceania | High1 |
| 31 | Spain | 52.85 | Europe | High1 |
| 32 | Chile | 52.20 | Latin America and the Caribbean | High1 |
| 33 | Cyprus | 52.20 | Northern Africa and Western Asia | High1 |
| 34 | Costa Rica | 51.47 | Latin America and the Caribbean | Upper-middle1 |
| 35 | Lithuania | 50.75 | Europe | High1 |
| 36 | Brunei Darussalam | 49.91 | East and Southeast Asia, Oceania | High1 |
| 37 | Latvia | 49.39 | Europe | High1 |
| 38 | Italy | 49.21 | Europe | High1 |
| 39 | Saudi Arabia | 48.78 | Northern Africa and Western Asia | High1 |
| 40 | Bahrain | 48.45 | Northern Africa and Western Asia | High1 |
Of the top 25, 16 are European1. Seven further non-European countries join Singapore and the United States: New Zealand (11th), Australia (12th), Canada (15th), the United Arab Emirates (19th), Israel (20th), Japan (22nd) and Qatar (24th)1. Malaysia, 27th, is the only country in the top quartile that is not high-income1. Chile and Cyprus print the same score, 52.20, at 32nd and 33rd1. Bahrain, 40th, closes this extract, and Costa Rica is 34th1.
Worked example (our arithmetic). Gaps between selected ranks, each the difference of two scores in the table1.
| From rank to rank | Calculation | Gap |
|---|---|---|
| 1 to 10 | 81.82 − 71.18 | 10.64 points1 |
| 10 to 25 | 71.18 − 59.38 | 11.80 points1 |
| 25 to 40 | 59.38 − 48.45 | 10.93 points1 |
| 1 to 25 | 81.82 − 59.38 | 22.44 points1 |
| 1 to 2 | 81.82 − 77.27 | 4.55 points1 |
| 2 to 3 | 77.27 − 76.64 | 0.63 points1 |
Two things stand out. The ranking is steepest at the top: the nine places from 1st to 10th cover 10.64 points, almost as many as the 15 places from 10th to 25th (11.80) or from 25th to 40th (10.93)1. And the very top is lopsided: Switzerland is 4.55 points clear of second place, while second and third are only 0.63 apart1.
How far ahead Switzerland was, edition by edition
Switzerland has held first place since the first GTCI in 2013, but the margin has not been constant3.
The chart and table show the gap between first place and the runner-up in four reports. Each gap is read inside one edition, because scores from different editions sit on different models.
Worked example (our arithmetic). Each lead subtracts the second-place score from Switzerland’s score in the same report6,2,1,3.
| Edition | First place | Second place | Lead |
|---|---|---|---|
| 2017 | Switzerland, 74.556 | Singapore, 74.096 | 74.55 − 74.09 = 0.46 points |
| 2018 | Switzerland, 79.902 | Singapore, 78.422 | 79.90 − 78.42 = 1.48 points |
| 2019 | Switzerland, 81.821 | Singapore, 77.271 | 81.82 − 77.27 = 4.55 points |
| 2020 | Switzerland, 81.263 | United States, 79.093 | 81.26 − 79.09 = 2.17 points |
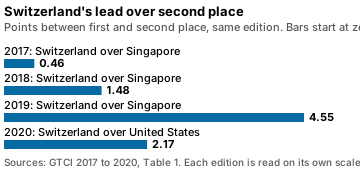
The 2019 lead is the widest of the four. By 2020 it had shrunk by more than half as the United States took second place1,3. A 4.55-point lead in 2019 is therefore a feature of that edition’s model and field, not a settled gap between Switzerland and everyone else.
National talent competitiveness in 2019
The top group is steady from year to year. Almost all the countries ranked in the top 15 of 2019 were in that group in the 2018 index1. Only one country, Ireland (16th, down from 13th), dropped out, and Germany (14th, up from 19th) is the new addition1. Thirteen of the 15 are among the top 15 performers in at least four of the six pillars, and the one pillar where several top-15 countries rank lower is Vocational and Technical Skills1. Countries just outside the group lead single pillars: Austria (18th) has the third-highest score on Vocational and Technical Skills and the United Arab Emirates (19th) the third-highest on Attract1. Israel (20th) is a top performer on Global Knowledge Skills, Japan (22nd) scores well on Enable, and Bahrain (40th) is among the best at attracting talent1.
The top 15, country by country
| Rank | Country | Highlighted strength | Highlighted weakness |
|---|---|---|---|
| 1 | Switzerland | Retain and Vocational and Technical Skills, global leader1 | Attract, 5th1 |
| 2 | Singapore | Enable, Attract and Global Knowledge Skills, 1st1 | Retain, 26th1 |
| 3 | United States | Grow, 1st1 | Attract, 14th1 |
| 4 | Norway | Retain, 2nd1 | Attract and Global Knowledge Skills, both 13th1 |
| 5 | Denmark | Enable, 3rd1 | Attract, 17th1 |
| 6 | Finland | Grow and Vocational and Technical Skills, both 4th1 | Enable, 14th1 |
| 7 | Sweden | Retain, 6th1 | Vocational and Technical Skills, 11th1 |
| 8 | Netherlands | Grow, 3rd1 | Global Knowledge Skills, 17th1 |
| 9 | United Kingdom | Global Knowledge Skills, 5th1 | Vocational and Technical Skills, 27th1 |
| 10 | Luxembourg | Attract, 2nd1 | Formal Education, 55th1 |
| 11 | New Zealand | Enable, 5th, and Attract, 4th1 | Vocational and Technical Skills, 20th1 |
| 12 | Australia | Attract and Global Knowledge Skills, both 8th1 | Vocational and Technical Skills, 21st1 |
| 13 | Iceland | Global Knowledge Skills, behind only Singapore1 | Attract, 18th1 |
| 14 | Germany | Vocational and Technical Skills, 3rd1 | Global Knowledge Skills, 23rd1 |
| 15 | Canada | Attract, 7th1 | Vocational and Technical Skills, 19th1 |
Switzerland is at the top because it is strong on all six pillars; Attract (5th) is its lowest pillar rank1. Its weakest sub-pillars are Internal Openness (14th) and Access to Growth Opportunities (10th)1. Singapore is uniformly strong in the sub-pillars behind its three first places, and its lowest pillar is Retain (26th)1. The United States leads Grow thanks to Formal Education (3rd), Lifelong Learning (2nd) and Access to Growth Opportunities (1st), and its lowest pillars are Attract (14th) and Retain (13th)1.
Several country profiles show the same split between home and abroad. Finland is 2nd on Internal Openness and 33rd on External Openness1. Iceland is 1st on Internal Openness and 52nd on External Openness1. Norway’s weak pillar, Attract, is dragged down by External Openness (31st)1. Germany’s return to the top 15 rests on a world-class pool of Vocational and Technical Skills (3rd), including Mid-Level Skills (3rd), while Attract (20th) and Global Knowledge Skills (23rd) sit outside the top 151. Denmark, 5th, has Attract (17th) as its one pillar outside the top 10, and Sweden, 7th, has Vocational and Technical Skills (11th) as its only one1.
Pillar definitions and weights are in the pillar guide, and the rankings hub lists the other editions.
Pillar leaders in GTCI 2019
Table A1 of the report names the top three on each pillar1.
| Pillar | 1st | 2nd | 3rd |
|---|---|---|---|
| Enable | Singapore | Switzerland | Denmark1 |
| Attract | Singapore | Luxembourg | United Arab Emirates1 |
| Grow | United States | Switzerland | Netherlands1 |
| Retain | Switzerland | Norway | Austria1 |
| Vocational and Technical (VT) Skills | Switzerland | United States | Germany1 |
| Global Knowledge (GK) Skills | Singapore | Iceland | United States1 |
Singapore leads three pillars and Switzerland two, the United States one1. Switzerland is also second on Enable and Grow, which is how it stays first overall without leading every pillar1. The 2020 ranking shows how the same table looked a year later. The pillar called Global Knowledge Skills here was relabelled Generalist Adaptive Skills in the 2025 edition4.
What changed since the 2018 edition
The top 25 holds the same countries as the 2018 table, in a different order1. Since the model was by and large unaltered, rank changes from 2018 can be considered reliable, particularly for the best-performing countries1. For lower positions, allow for the two countries that dropped out for lack of data, Bolivia and the Former Yugoslav Republic of Macedonia, and for eight new additions1.
Worked example (our arithmetic). Each change subtracts the 2019 rank from the 2018 rank, read from Table 1 of the GTCI 2018 report and of the 2019 report2,1. A positive change is a climb. The 2020 column is context only, from the GTCI 2020 report3.
| Country | 2018 rank | 2019 rank | 2020 rank | Change 2018 to 2019 |
|---|---|---|---|---|
| Switzerland | 12 | 11 | 13 | no change2,1 |
| Singapore | 22 | 21 | 33 | no change2,1 |
| United States of America | 32 | 31 | 23 | no change2,1 |
| Norway | 42 | 41 | 93 | no change2,1 |
| Denmark | 72 | 51 | 53 | up 22,1 |
| Finland | 62 | 61 | 73 | no change2,1 |
| Sweden | 52 | 71 | 43 | down 22,1 |
| Netherlands | 92 | 81 | 63 | up 12,1 |
| United Kingdom | 82 | 91 | 123 | down 12,1 |
| Luxembourg | 102 | 101 | 83 | no change2,1 |
| New Zealand | 122 | 111 | 163 | up 12,1 |
| Australia | 112 | 121 | 103 | down 12,1 |
| Iceland | 142 | 131 | 143 | up 12,1 |
| Germany | 192 | 141 | 113 | up 52,1 |
| Canada | 152 | 151 | 133 | no change2,1 |
| Ireland | 132 | 161 | 153 | down 32,1 |
| Belgium | 162 | 171 | 183 | down 12,1 |
| Austria | 182 | 181 | 173 | no change2,1 |
| United Arab Emirates | 172 | 191 | 223 | down 22,1 |
| Israel | 242 | 201 | 203 | up 42,1 |
| France | 212 | 211 | 213 | no change2,1 |
| Japan | 202 | 221 | 193 | down 22,1 |
| Estonia | 222 | 231 | 243 | down 12,1 |
| Qatar | 232 | 241 | 293 | down 12,1 |
| Czech Republic | 252 | 251 | 253 | no change2,1 |
Of the 25 countries, 6 rose, 9 fell and 10 kept their rank between 2018 and 20192,1. Germany climbed five places (19th to 14th) and Israel four (24th to 20th), while Ireland fell three (13th to 16th)2,1. Sweden, Japan and the United Arab Emirates fell two places each, and Denmark gained two2,1.
Scores moved the other way from ranks. Sixteen of the 25 countries scored lower in 2019 than in 2018, and only nine scored higher, yet 10 kept the same rank2,1. Singapore, for instance, kept second place while its score went from 78.42 to 77.272,1. A rank is relative, so it can hold while a score slips if the countries around it slip too. This is the practical reason to quote an edition year beside every figure.
Regions and income groups
Income and rank travel together in 2019. The top performers are all high-income countries, and only one country in the top quartile is not: Malaysia, 27th1. All but one high-income country scored above the median, the exception being Kuwait, the first country below it1. The Philippines leads the lower-middle-income group and Rwanda leads the low-income group1. The index included 49 high-income countries, and the lowest-ranked of them on the Retain pillar is in position 571.
Regions follow. Besides Europe and Northern America, two regions place countries among the top 31: Eastern, Southeastern Asia and Oceania with five and Northern Africa and Western Asia with three1. No country from Central and Southern Asia, Latin America and the Caribbean, or Sub-Saharan Africa is in the top quartile, although Chile, 32nd, is just outside it1. The gaps between the three lower income groups are narrower than the distance each has to the high-income group1.
| Group | Best three countries |
|---|---|
| Europe | Switzerland, Norway, Denmark1 |
| East and Southeast Asia, Oceania | Singapore, New Zealand, Australia1 |
| Northern Africa and Western Asia | United Arab Emirates, Israel, Qatar1 |
| Latin America and the Caribbean | Chile, Costa Rica, Uruguay1 |
| Central and Southern Asia | Kazakhstan, India, Tajikistan1 |
| Sub-Saharan Africa | Mauritius, Botswana, South Africa1 |
| Upper-middle-income countries | Malaysia, Costa Rica, Azerbaijan1 |
| Lower-middle-income countries | Philippines, Ukraine, Indonesia1 |
| Low-income countries | Rwanda, Gambia, Senegal1 |
Entrepreneurial talent, the 2019 theme
The 2019 report asks what entrepreneurial talent adds to national competitiveness. Its first message is that talent inequalities are broadening: the gap separating the talent champions from the rest has been growing rather than diminishing1. The second is that talent has become a mainstream concern for firms, nations and cities1. The third is that entrepreneurial talent can both broaden and reduce inequalities, and should be seen as a state of mind that can be grown with policies, incentives and management approaches1. A sixth message expects cities to become entrepreneurial talent hubs1.
The data behind the theme comes from one variable, new product entrepreneurial activity: the share of early-stage entrepreneurs whose product or service is new to at least some customers and that few or no other businesses offer1. On that variable Luxembourg is first and Chile second, with France third, Lebanon fourth and Canada fifth1. Russia is one of the lowest-scoring countries1. The broader Talent Impact sub-pillar adds Innovation output, High-value exports, New business density and Scientific journal articles, and there the top performers are concentrated in high-income Europe, Northern America and Oceania1. One implication for entrepreneurial talent is that it needs to be cross-border and cross-sector, since successful entrepreneurs must convince banks, researchers, suppliers, consumers and workers of their vision1.
The 2019 model change follows the same logic. The number of variables stayed at 68, but the model was altered to capture entrepreneurship that is original and geared to new products and approaches1.
A first look across two three-year periods
The 2019 report opens the series’ time-series analysis, comparing 2014 to 2016 with 2017 to 20191,3. Averaging three years smooths annual fluctuations and absorbs changes in method1. Only countries in all six reports are included: 861. The method has a stated drawback, which is that scores are not fully comparable between years because of data changes and methodological improvements1.
The result is stability at the top and churn below it. Eight of the top 10 of 2014 to 2016 were also in the top 10 of 2017 to 20191. Switzerland and Singapore are at the peak in both periods, and the United States climbs from 4th to 3rd1. Luxembourg and Canada drop out of the top 10, although their scores rose, because other countries outperformed them1. Among the large emerging economies, China rose two places to 41st, India four to 71st and Russia one to 46th, while Brazil fell 12 places (50th to 62nd) and South Africa eight (48th to 56th)1. Indonesia climbed most, from 77th to 64th1. Changes in ranking, especially larger shifts, are more likely at lower positions than at higher ones1.
On income groups the high-income distribution moved up while the upper-middle and lower-middle distributions moved down1. Two opposing trends are at work: talent competitiveness strengthens in groups of countries where it is already comparatively high and weakens where it is relatively low1. A possible reason is that economic expansion in several more developed countries generated greater demand for talent1.
The GTCI and the Global Competitiveness Index
The Global Competitiveness Index (GCI) ranking is a different product from the GTCI, made by the World Economic Forum. The 2019 edition of its report covers 141 economies and defines competitiveness as the set of institutions, policies and factors that determine the level of productivity5. Singapore (84.8) overtook the United States (83.7) at the top of that table5. The GTCI ranks 125 countries on talent and put Switzerland first in the same year1. A search for “GCI ranking” and for the GTCI can land on either, so check which index and which year a figure belongs to before you quote it.
The 2019 model and its neighbours
The model has 68 variables in 2019, unchanged from 2018, and the audit by the European Commission’s Joint Research Centre confirmed that the changes improved its accuracy while keeping it solid and robust1. Coverage and variables differ across the editions near it.
| Edition | Countries | Variables |
|---|---|---|
| GTCI 2018 | 1191 | 681 |
| GTCI 2019 | 1251 | 681 |
| GTCI 2020 | 1323 | 703 |
| GTCI 2025 | 1354 | 774 |
The model is stable from 2018 to 2019, so rank changes between them are fairly reliable1. The step to 2020 went from 68 to 70 variables and from 125 to 132 countries, so scores are best read inside one edition3. The 2020 ranking page has that edition’s table. For how the index is built, see the methodology page.
The cities ranking in the 2019 report
The 2019 report also ranks cities, with the Global City Talent Competitiveness Index now including 114 cities1. Washington, DC is first, up from 6th, followed by Copenhagen, Oslo, Vienna and Zurich1. Six of the top 10 were also in the top 10 the year before, and the newcomers are Vienna, Boston, New York and Seoul1. The highest-ranked cities of mainland China, Beijing (57th), Shanghai (72nd) and Hangzhou (82nd), are in the second quartile1.
Who produced the 2019 report
The 2019 report was edited by Bruno Lanvin and Felipe Monteiro, and its copyright line names INSEAD, the Adecco Group and Tata Communications1. A disclaimer adds that the methodology and rankings do not necessarily present the views of those three organisations1. INSEAD’s partner profile lists campuses in Europe (France), Asia (Singapore) and the Middle East (Abu Dhabi), 154 faculty members from 40 countries and more than 1,400 degree participants annually1. It records the first MBA class graduating at Fontainebleau in 1960 and the Asia campus opening in Singapore in 20001. The Adecco Group’s profile gives more than 34,000 employees in 60 countries, and Tata Communications presents itself as a global digital infrastructure provider1. These are 2019 self-descriptions, not a current profile. The editions page tracks the partners on every report.
Other editions: the GTCI 2018 ranking comes before this one, and the GTCI 2021 ranking and 2017 results carry full tables, and the Switzerland and Singapore story follows the top two across the series.
Common questions
What is the Global Talent Competitiveness Index (GTCI)?
The GTCI is a composite index that, in its 2019 edition, scores 125 countries on how well they grow, attract and retain talent1. Its overall score is the simple average of six pillar scores1.
Which country is very talented?
In the GTCI 2019 edition Switzerland ranks first with 81.82, ahead of Singapore (77.27) and the United States (76.64)1. The index scores national systems for developing and keeping talent, so the answer names a country's policies, not its people1.
Which country topped the Global Competitiveness Index?
In the World Economic Forum's Global Competitiveness Report 2019, Singapore (84.8) overtook the United States (83.7) at the top of the GCI 4.0 rankings, which cover 141 economies5. That is a different index from the GTCI, whose 2019 edition put Switzerland first1.
RelatedGTCI 2018 ranking: top 40 of 119 countries and scoresGTCI 2020 ranking: top 40 of 132 countries and scoresGTCI editions 2013 to 2023: themes, coverage, top three
Sources
- The Global Talent Competitiveness Index 2019: Entrepreneurial talent and global competitiveness · INSEAD, Adecco Group and Tata Communications, GTCI 2019 · globaltalentcompetitivenessindex.org · checked October 22, 2026
- The Global Talent Competitiveness Index 2018: Diversity for competitiveness · INSEAD, Adecco Group and Tata Communications, GTCI 2018 · globaltalentcompetitivenessindex.org · checked October 22, 2026
- The Global Talent Competitiveness Index 2020: Global talent in the age of artificial intelligence · INSEAD, the Adecco Group and Google, GTCI 2020 · globaltalentcompetitivenessindex.org · checked October 22, 2026
- Global Talent Competitiveness Index 2025: Talent and resilience · INSEAD and Portulans Institute, GTCI 2025 · portulansinstitute.org · checked October 22, 2026
- The Global Competitiveness Report 2019 · World Economic Forum, Global Competitiveness Report 2019 · www3.weforum.org · checked October 22, 2026
- The Global Talent Competitiveness Index 2017: Talent and technology · INSEAD, Adecco Group and Tata Communications, GTCI 2017 · globaltalentcompetitivenessindex.org · checked October 22, 2026
Image credits (2)
Published . Rankings change with every edition: each figure names its edition year and each source shows the day it was checked. How we check facts · Report an error.