On this page
- The 2018 ranking: top 40 of 119
- Scores rose, ranks held: 2017 against 2018
- The top 15, country by country
- Pillar leaders named in the 2018 report
- Regions and income groups
- Diversity, the theme of the 2018 edition
- What changed in the 2018 model
- The GTCI and the Global Competitiveness Index
- The cities ranking in the 2018 report
- Who produced the 2018 report
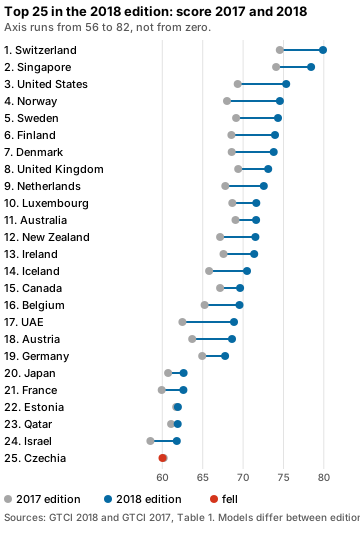
The 2018 edition is the fifth in the series and the one built around diversity1. At the top it kept the order of 2017’s first two: Switzerland first, Singapore second, with the United States moving up to third2,1. Underneath, the table moved more. Norway climbed from 10th to 4th, the United Kingdom fell from 3rd to 8th, and almost every top-25 score was higher than a year earlier, a jump that says as much about the model as about the countries2,1. Below are the table, the shifts against 2017, the top 15 country by country, the pillar leaders the report names, the regional and income picture and the diversity theme.
The 2018 ranking: top 40 of 119
The ranking comes from Table 1 of the GTCI 2018 report, which scores each country and gives its income group and region1. Forty rows are reproduced below with the printed scores1. Coverage is 119 countries, up from 118, representing almost 98% of the world’s GDP and 89% of its population1.
| Rank | Country | Score | Region | Income group |
|---|---|---|---|---|
| 1 | Switzerland | 79.90 | Europe | High1 |
| 2 | Singapore | 78.42 | East and Southeast Asia, Oceania | High1 |
| 3 | United States of America | 75.34 | Northern America | High1 |
| 4 | Norway | 74.56 | Europe | High1 |
| 5 | Sweden | 74.32 | Europe | High1 |
| 6 | Finland | 73.95 | Europe | High1 |
| 7 | Denmark | 73.79 | Europe | High1 |
| 8 | United Kingdom | 73.11 | Europe | High1 |
| 9 | Netherlands | 72.56 | Europe | High1 |
| 10 | Luxembourg | 71.64 | Europe | High1 |
| 11 | Australia | 71.61 | East and Southeast Asia, Oceania | High1 |
| 12 | New Zealand | 71.52 | East and Southeast Asia, Oceania | High1 |
| 13 | Ireland | 71.38 | Europe | High1 |
| 14 | Iceland | 70.48 | Europe | High1 |
| 15 | Canada | 69.63 | Northern America | High1 |
| 16 | Belgium | 69.56 | Europe | High1 |
| 17 | United Arab Emirates | 68.88 | Northern Africa and Western Asia | High1 |
| 18 | Austria | 68.63 | Europe | High1 |
| 19 | Germany | 67.77 | Europe | High1 |
| 20 | Japan | 62.63 | East and Southeast Asia, Oceania | High1 |
| 21 | France | 62.61 | Europe | High1 |
| 22 | Estonia | 61.93 | Europe | High1 |
| 23 | Qatar | 61.90 | Northern Africa and Western Asia | High1 |
| 24 | Israel | 61.79 | Northern Africa and Western Asia | High1 |
| 25 | Czech Republic | 60.02 | Europe | High1 |
| 26 | Malta | 58.77 | Europe | High1 |
| 27 | Malaysia | 58.51 | East and Southeast Asia, Oceania | Upper-middle1 |
| 28 | Slovenia | 55.77 | Europe | High1 |
| 29 | Portugal | 55.75 | Europe | High1 |
| 30 | Korea, Rep. | 55.57 | East and Southeast Asia, Oceania | High1 |
| 31 | Spain | 54.91 | Europe | High1 |
| 32 | Lithuania | 53.31 | Europe | High1 |
| 33 | Chile | 52.95 | Latin America and the Caribbean | High1 |
| 34 | Latvia | 52.27 | Europe | High1 |
| 35 | Costa Rica | 51.38 | Latin America and the Caribbean | Upper-middle1 |
| 36 | Italy | 50.55 | Europe | High1 |
| 37 | Cyprus | 50.29 | Northern Africa and Western Asia | High1 |
| 38 | Bahrain | 50.16 | Northern Africa and Western Asia | High1 |
| 39 | Poland | 50.06 | Europe | High1 |
| 40 | Slovakia | 50.02 | Europe | High1 |
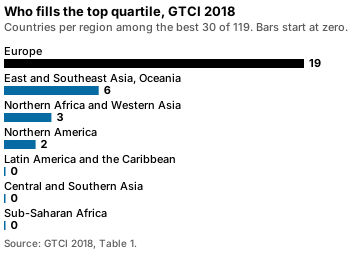
European countries hold 16 of the top 25 places, as in the year before1. Singapore (2nd) and the United States (3rd) are the two non-European countries in the top 101. Seven more non-European countries reach the top 25: Australia (11th), New Zealand (12th), Canada (15th), the United Arab Emirates (17th), Japan (20th), Qatar (23rd) and Israel (24th)1. Malaysia, 27th, is the only upper-middle-income country in the top 301. Slovenia (28th), Portugal (29th) and South Korea (30th) complete the top quartile1. Chile is 33rd, Costa Rica 35th and Bahrain 38th1.
Worked example (our arithmetic). Six score gaps, each one a subtraction of two table scores1.
| From rank to rank | Calculation | Gap |
|---|---|---|
| 1 to 10 | 79.90 − 71.64 | 8.26 points1 |
| 10 to 25 | 71.64 − 60.02 | 11.62 points1 |
| 25 to 40 | 60.02 − 50.02 | 10.00 points1 |
| 1 to 25 | 79.90 − 60.02 | 19.88 points1 |
| 1 to 2 | 79.90 − 78.42 | 1.48 points1 |
| 2 to 3 | 78.42 − 75.34 | 3.08 points1 |
The two bottom rows have the opposite shape from the 2019 ranking, where first place was far ahead and second and third nearly level. In 2018 the first two are close, and third place is 3.08 points behind second1.
Scores rose, ranks held: 2017 against 2018
The top 25 of 2018 is virtually unchanged from the previous edition1. Since few methodological changes were made, the changes in ranking from the year before can be considered reliable, particularly in the first quartile1. Germany slipped a few positions outside the top 15 while Iceland made it in1.
Worked example (our arithmetic). Each change subtracts the 2018 rank from the 2017 rank, read from Table 1 of the GTCI 2017 report and of the 2018 report2,1. A positive change is a climb. The 2019 column, from the GTCI 2019 report, is context only3.
| Country | 2017 rank | 2018 rank | 2019 rank | Change 2017 to 2018 |
|---|---|---|---|---|
| Switzerland | 12 | 11 | 13 | no change2,1 |
| Singapore | 22 | 21 | 23 | no change2,1 |
| United States of America | 42 | 31 | 33 | up 12,1 |
| Norway | 102 | 41 | 43 | up 62,1 |
| Sweden | 52 | 51 | 73 | no change2,1 |
| Finland | 92 | 61 | 63 | up 32,1 |
| Denmark | 82 | 71 | 53 | up 12,1 |
| United Kingdom | 32 | 81 | 93 | down 52,1 |
| Netherlands | 112 | 91 | 83 | up 22,1 |
| Luxembourg | 72 | 101 | 103 | down 32,1 |
| Australia | 62 | 111 | 123 | down 52,1 |
| New Zealand | 142 | 121 | 113 | up 22,1 |
| Ireland | 122 | 131 | 163 | down 12,1 |
| Iceland | 152 | 141 | 133 | up 12,1 |
| Canada | 132 | 151 | 153 | down 22,1 |
| Belgium | 162 | 161 | 173 | no change2,1 |
| United Arab Emirates | 192 | 171 | 193 | up 22,1 |
| Austria | 182 | 181 | 183 | no change2,1 |
| Germany | 172 | 191 | 143 | down 22,1 |
| Japan | 222 | 201 | 223 | up 22,1 |
| France | 242 | 211 | 213 | up 32,1 |
| Estonia | 202 | 221 | 233 | down 22,1 |
| Qatar | 212 | 231 | 243 | down 22,1 |
| Israel | 252 | 241 | 203 | up 12,1 |
| Czech Republic | 232 | 251 | 253 | down 22,1 |
Of the 25 countries, 11 rose, 9 fell and 5 kept the same rank between 2017 and 20182,1. Norway made the biggest climb, six places from 10th to 4th, followed by Finland (9th to 6th) and France (24th to 21st) with three each2,1. The United Kingdom (3rd to 8th) and Australia (6th to 11th) fell five places each, and Luxembourg fell three (7th to 10th)2,1.
The scores tell a different story from the ranks. Scores rose for 24 of the 25 countries, and Czechia is the only one that fell, from 60.17 to 60.022,1. Switzerland went from 74.55 to 79.90 and Singapore from 74.09 to 78.422,1. A rise of that size across almost the whole table cannot be 24 countries improving at once. The model grew from 65 to 68 variables, so part of the move is the yardstick1. Ranks are the safer bridge between 2017 and 2018, and even they should be read with the first-quartile caveat the report gives1.
The top 15, country by country
The group of countries in the top 15 is quite stable, although they sometimes switch positions1. Switzerland and its neighbours at the top perform strongly in each of the six pillars, and a few countries just outside the group lead single pillars: Germany (19th) is one of the leaders in Vocational and Technical Skills, Austria (18th) ranks highly there too, the United Arab Emirates (19th) and Qatar (21st) are strong magnets of talent on Attract, and Estonia (22nd) and Israel (24th) are top performers in Global Knowledge Skills1.
| Rank | Country | Highlighted strength | Highlighted weakness |
|---|---|---|---|
| 1 | Switzerland | Retain, 1st1 | Internal Openness sub-pillar, 13th1 |
| 2 | Singapore | Enable, leader1 | Access to Growth Opportunities, 16th1 |
| 3 | United States | Grow, 2nd1 | Attract, 18th1 |
| 4 | Norway | Retain, 2nd1 | Attract, 12th1 |
| 5 | Sweden | Retain, 4th1 | Business and Labour Landscape sub-pillar, 19th1 |
| 6 | Finland | Formal Education, 1st, and Grow, 4th1 | External Openness sub-pillar, 35th1 |
| 7 | Denmark | Enable, 3rd1 | Attract, room to lure foreign talent1 |
| 8 | United Kingdom | Global Knowledge Skills, 3rd1 | Vocational and Technical Skills, 25th1 |
| 9 | Netherlands | Grow, 1st1 | Attract, 17th1 |
| 10 | Luxembourg | Attract, 2nd1 | Formal Education sub-pillar, 51st1 |
| 11 | Australia | Attract, 7th1 | Vocational and Technical Skills, 24th1 |
| 12 | New Zealand | Enable, 4th1 | Cluster development variable, 45th1 |
| 13 | Ireland | Attract, 9th1 | Formal Education sub-pillar, 22nd1 |
| 14 | Iceland | Global Knowledge Skills, 5th1 | Attract, 19th1 |
| 15 | Canada | Attract, 10th1 | Vocational and Technical Skills, 22nd1 |
Switzerland is at the top by virtue of strong performance across all six pillars, with Enable 2nd, Retain 1st and Vocational and Technical Skills 3rd, and it never drops out of the top 10 in any pillar1. Its Internal Openness sub-pillar (13th) combines good social mobility (2nd) with lagging gender equality variables: Female graduates (86th) and Leadership opportunities for women (21st)1. Singapore is top across Enable and Attract, with only Tolerance of immigrants showing a relatively poorer result1. The United States leads on Grow thanks to Formal Education (2nd) and an unrivalled Access to Growth Opportunities (1st)1.
Several profiles turn on the same gap between openness at home and openness abroad. Sweden is 2nd on Internal Openness and 22nd on External Openness, and Finland is 3rd on Internal and 35th on External1. The United Kingdom has good External Openness (6th) but Internal Openness (18th) has room to improve, and the report adds that it remains to be determined whether Brexit alters its performance1. Luxembourg’s second place on Attract rests on External Openness (3rd) and Internal Openness (6th), while its Formal Education (51st) lags1. Canada is the second most tolerant country of immigrants in the world, and Iceland ranks 19th on Attract1.
Pillar leaders named in the 2018 report
The 2018 annex does not print a top-three table for each pillar as the later reports do, so the leaders below are the ones its text names1.
| Pillar | Countries the report names |
|---|---|
| Enable | Singapore, leader; Switzerland, 2nd; Denmark, 3rd1 |
| Attract | Singapore, top performer; Luxembourg, 2nd1 |
| Grow | Netherlands, 1st; United States, 2nd1 |
| Retain | Switzerland, 1st; Norway, 2nd1 |
| Vocational and Technical (VT) Skills | United Arab Emirates, 1st; Switzerland, 3rd; Germany, 4th; Austria, 7th1 |
| Global Knowledge (GK) Skills | United States, 2nd; United Kingdom, 3rd; Australia, 6th; New Zealand, 7th1 |
The United Arab Emirates is first on Vocational and Technical Skills, but its data for some key variables were older than the threshold the index sets, and the report flags its position as less reliable than the others1. English-speaking economies do well on Global Knowledge Skills yet leave gaps in vocational skills: the United Kingdom ranks 25th there and Australia 24th1. Countries differ much more on Retain than on Grow, so retaining talent separates the table more than growing it1. The pillar called Global Knowledge Skills was relabelled Generalist Adaptive Skills in the 2025 edition4.
Regions and income groups
The top performers are all high-income countries1. The high-income group has a virtual stranglehold on the top 30, from Switzerland (1st) down to South Korea (30th)1. Malaysia (27th) leads the upper-middle-income group and the Philippines (54th) the lower-middle-income group1. Differences between income groups are larger on the Output side, above all on Global Knowledge Skills, than on the Input side1. Four high-income countries sit outside the top 50: Hungary (52nd), Trinidad and Tobago (55th), Oman (56th) and Kuwait (65th)1. Argentina (49th), Russia (53rd) and Venezuela (105th) were high-income in earlier years and now count as upper-middle-income1. Chile has the highest ranking in its region, and for years it topped the upper-middle-income group before it was classified as high-income in 20161.
Regions follow the same order. The regions with no country in the top 30 are Central and Southern Asia, Latin America and the Caribbean, and Sub-Saharan Africa1. Malaysia is the standout among emerging economies, ranking first in the world on Collaboration across organisations, and Costa Rica (35th) sits above Italy, Poland, Slovakia and Saudi Arabia1.
| Group | Best three countries |
|---|---|
| Europe | Switzerland, Norway, Sweden1 |
| East and Southeast Asia, Oceania | Singapore, Australia, New Zealand1 |
| Northern Africa and Western Asia | United Arab Emirates, Qatar, Israel1 |
| Latin America and the Caribbean | Chile, Costa Rica, Uruguay1 |
| Central and Southern Asia | Kazakhstan, India, Sri Lanka1 |
| Sub-Saharan Africa | Mauritius, Botswana, South Africa1 |
| Upper-middle-income countries | Malaysia, Costa Rica, China1 |
| Lower-middle-income countries | Philippines, Ukraine, Armenia1 |
| Low-income countries | Rwanda, Gambia, Senegal1 |
Diversity, the theme of the 2018 edition
The 2018 report treats diversity as a competitiveness question, in seven key messages1. Talent diversity is still a largely untapped resource for innovation, and organisations, cities and nations are slowly learning how to use it1. Cognitive diversity, meaning different knowledge, experience and perspectives, is what drives innovation through teamwork, and teams of diverse people outperform teams of talented but similar people1. The index measures it indirectly, through collaboration within and across organisations, plus attention to gender diversity1. Inclusion and diversity go together: to use diversity, organisations must build inclusive norms and cultures where voices are heard without the filter of unconscious bias1.
Two messages concern institutions. Formal education from kindergarten to tertiary level has a crucial role in building the competences for a more inclusive world, alongside diversity training in organisations1. Using diversity also takes bold and visionary leadership, because without it similar people tend to cluster in tribes, cliques and cohorts1. The last two messages turn to cities: municipal leadership and local engagement are key to their success as talent hubs, and cities are perfect labs for promoting diversity1. The 2018 edition widened its cities section to 90 cities from 46 the year before1.
What changed in the 2018 model
The model gained questions on the quality of collaboration within and across organisations, because collaboration is becoming more important in the knowledge economy1. Its labour-market components were strengthened with measures of active labour market policies and an improved measure of Employability, the extent to which skills match the needs of the economy1. The number of variables rose from 65 to 68 and coverage from 118 to 119 countries1. The audit by the European Commission’s Joint Research Centre confirmed that the changes improved the model’s accuracy1.
| Edition | Countries | Variables |
|---|---|---|
| GTCI 2017 | 1181 | 651 |
| GTCI 2018 | 1191 | 681 |
| GTCI 2019 | 1253 | 683 |
| GTCI 2025 | 1354 | 774 |
Both steps are described as safe for comparing ranks: few methodological changes from 2017 to 20181, and a model by and large unaltered from 2018 to 20193. The methodology page explains how the pillars are built, and the rankings hub lists the other editions.
The GTCI and the Global Competitiveness Index
The Global Competitiveness Index (GCI) ranking is a separate product of the World Economic Forum. Its 2018 report covers 140 economies and defines competitiveness as the set of institutions, policies and factors that determine the level of productivity5. The United States is first with 85.6, followed by Singapore (83.5) and Germany (82.8), with Switzerland (82.6) in 4th place5. The GTCI ranks 119 countries on talent and puts Switzerland first, so the two tables can disagree about the same country in the same year1,5. For talent figures, cite the GTCI edition year with each rank.
The cities ranking in the 2018 report
The 2018 report also ranks cities. Its Global City Talent Competitiveness Index covers 90 cities, up from 461. Zurich is first with 71.0, followed by Stockholm (68.2), Oslo (68.1) and Copenhagen (67.1)1. The cities model was updated to make it clearly distinct from the country index1.
Who produced the 2018 report
The 2018 report was edited by Bruno Lanvin and Paul Evans1. Its copyright line names INSEAD, the Adecco Group and Tata Communications1. INSEAD’s partner profile lists campuses in Europe (France), Asia (Singapore) and the Middle East (Abu Dhabi), 145 faculty members from 40 countries and more than 1,400 degree participants a year1. It dates the first MBA class at Fontainebleau to 1960 and the Asia campus in Singapore to 20001. The Adecco Group’s profile gives permanent and flexible employment to more than 700,000 people every day and counts more than 33,000 employees in 60 countries1. These are 2018 self-descriptions, not a current profile. The editions page tracks the partners on each report.
Other editions: the 2017 results and the GTCI 2021 ranking carry full tables, and the Switzerland and Singapore story follows the top two across the series.
Common questions
What is the Global Talent Competitiveness Index (GTCI)?
The GTCI is a composite index that, in its 2018 edition, scores 119 countries on how well they grow, attract and retain talent1. Its overall score is the simple average of six pillar scores1.
Which country has the most talented people?
In the GTCI 2018 edition Switzerland ranks first with 79.90, ahead of Singapore (78.42) and the United States (75.34)1. The index scores national systems for developing and keeping talent, so the answer reflects policies and practices, not individuals1.
Which country topped the Global Competitiveness Index?
In the World Economic Forum's Global Competitiveness Report 2018 the United States ranked first among 140 economies with 85.6, followed by Singapore (83.5) and Germany (82.8)5. That is a different index from the GTCI, whose 2018 edition put Switzerland first1.
RelatedGTCI 2019 ranking: top 40 of 125 countries and scoresGTCI 2017 results: top 25 ranking and findingsGTCI editions 2013 to 2023: themes, coverage, top three
Sources
- The Global Talent Competitiveness Index 2018: Diversity for competitiveness · INSEAD, Adecco Group and Tata Communications, GTCI 2018 · globaltalentcompetitivenessindex.org · checked October 22, 2026
- The Global Talent Competitiveness Index 2017: Talent and technology · INSEAD, Adecco Group and Tata Communications, GTCI 2017 · globaltalentcompetitivenessindex.org · checked October 22, 2026
- The Global Talent Competitiveness Index 2019: Entrepreneurial talent and global competitiveness · INSEAD, Adecco Group and Tata Communications, GTCI 2019 · globaltalentcompetitivenessindex.org · checked October 22, 2026
- Global Talent Competitiveness Index 2025: Talent and resilience · INSEAD and Portulans Institute, GTCI 2025 · portulansinstitute.org · checked October 22, 2026
- The Global Competitiveness Report 2018 · World Economic Forum, Global Competitiveness Report 2018 · www3.weforum.org · checked October 22, 2026
Image credits (2)
Published . Rankings change with every edition: each figure names its edition year and each source shows the day it was checked. How we check facts · Report an error.