On this page
- The ten reports at a glance
- Why a 2017 report was printed in 2016
- Edition by edition
- How the model and coverage changed
- Who made the top three
- The city index that grew beside it
- What ten editions agree on
- Comparing editions without misleading yourself
- Who produced the reports
- The gap in 2024 and the 2025 edition
Search for the GTCI report and the results are a pile of PDFs with years that do not line up: a report titled 2017 printed in 20164, a title with a hyphen3, a gap where 2024 should be11. This page puts the series in one table and answers what that table raises: what each edition was about, how the model and the country list grew, who partnered on what, and what the ten editions agree on. It leaves the scores of different editions side by side only where that is safe. Mostly it is not.
The ten reports at a glance
One row per edition, listed under the title year printed on the report. Every figure names its own edition; scores are left out on purpose, because each edition rescales its model.
| Title year | Edition | Theme | Countries | Indicators | First, second, third |
|---|---|---|---|---|---|
| 2013 | first1 | Launch edition | 1031 | 481 | Switzerland, Singapore, Denmark1 |
| 2014 | second2 | Growing talent for today and tomorrow | 932 | 652 | Switzerland, Singapore, Luxembourg2 |
| 2015-16 | third3 | International mobility and talent attraction | 1093 | 613 | Switzerland, Singapore, Luxembourg3 |
| 2017 | fourth4 | Talent and technology | 1184 | 654 | Switzerland, Singapore, United Kingdom4 |
| 2018 | fifth5 | Diversity for competitiveness | 1195 | 685 | Switzerland, Singapore, United States5 |
| 2019 | sixth6 | Entrepreneurial talent and global competitiveness | 1256 | 686 | Switzerland, Singapore, United States6 |
| 2020 | seventh7 | Global talent in the age of artificial intelligence | 1327 | 707 | Switzerland, United States, Singapore7 |
| 2021 | eighth8 | Talent competitiveness in times of COVID | 1348 | 688 | Switzerland, Singapore, United States8 |
| 2022 | ninth9 | The tectonics of talent | 1339 | 699 | Switzerland, Singapore, Denmark9 |
| 2023 | tenth10 | What a difference ten years make | 13410 | 6910 | Switzerland, Singapore, United States10 |
The eleventh edition, in 2025, ranks 135 countries on 77 indicators and puts Singapore ahead of Switzerland11. The 2025 results page has the full table, and the rankings hub lists every ranking page.
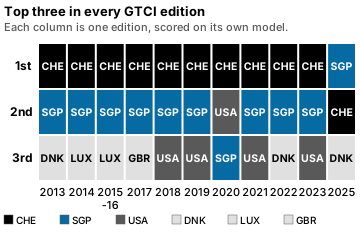
Two patterns jump out. Coverage rose in almost every edition, with dips in 2014 and 20221,2,8,9. And the podium was nearly a closed shop: Switzerland first all ten times, Singapore second in nine of them10. That is the series in one line. The rest of this page is the detail that makes it usable.
Why a 2017 report was printed in 2016
The title year is not always the print year. The first two reports carry the year they were printed, 2013 and 20146. Reports are printed towards the end of the calendar year, but the launch used to be held in January, so from the third edition the title carries the launch year6. That edition became the 2015-16 report, and the next two were titled 2017 and 20186. The 2017 report prints its own date as December 20164.
The effect is a trap for anyone counting. The span 2013 to 2018 holds five editions, not six, a point the 2023 report itself takes the trouble to explain10. The eighth edition came out in the fall, away from the late-January Davos slot, because of the pandemic, and was launched virtually8. So reading the title year as the launch year worked for a few editions and is not a rule.
A practical rule for citing: use the title year exactly as printed on the report and add the edition number if there is any doubt. No report is titled 2016. The 2019 report does use the year 2016 in its trend analysis, but there it means the results of the report titled 2015-16, and 2014 means the results of the report titled 20136. That is a labelling choice inside one analysis, not a title to copy.
Edition by edition
2013: the first index
The first report ranked 103 countries, covering 86.3% of the world’s population and 96.7% of its GDP in current US dollars1. It rested on 48 indicators: 19 hard-data variables, 9 taken from existing indexes and 20 from surveys1. Its authors came to the subject from two earlier INSEAD indices, one on information technology and one on innovation1. The index began with a conversation between INSEAD’s eLab and Singapore’s Minister of Manpower, a year before the first report came out10. The report was launched in Singapore2. Its first key message was that the global contest for talent is uneven10.
2014: growing talent
The second edition chose the theme growing talent for today and tomorrow2. The model jumped from 48 variables to 65, and the data set covered 93 countries, down from 103, representing 83.8% of the world’s population and 96.2% of its GDP1,2. Hard-data indicators grew from 19 to 31 and survey indicators from 20 to 241,2. The edition stressed that technological change would reach new segments of the labour market and change the profile of employable skills10.
2015-16: mobility and attraction
The third edition trimmed the model from 65 variables to 61, and the stricter choice of variables brought coverage up from 93 to 109 countries, representing 87.4% of the world’s population and 97% of its GDP3. Its theme, international mobility and talent attraction, is singled out in HCLI’s foreword as significant for Asia and ASEAN3. INSEAD, the Adecco Group and HCLI were the partners3. The edition’s warning was that low-skilled workers keep being replaced by robots while knowledge workers are displaced by algorithms10.
2017: talent and technology
The fourth edition added an Employability sub-pillar under Vocational and Technical Skills, a measure of skill gaps and labour market mismatches4. Variables rose from 61 to 65 and coverage from 109 to 118 countries, 97.3% of world GDP and about 88.7% of population4. The edition also launched the Global Cities Talent Competitiveness Index, whose first top three was Copenhagen, Zurich and Helsinki4. The message to workers was to expect several jobs over a working life and plan continuous upskilling4. A key message of the edition was that technology is changing the nature of work10. The 2017 results page carries the full table, and talent and technology tests the edition’s messages against later data.
2018: diversity
The fifth edition took diversity as its subject5. The model grew from 65 to 68 variables and coverage from 118 to 119 countries, almost 98% of world GDP and 89% of population5. The city section grew to 90 cities, against 46 the year before5. INSEAD, the Adecco Group and Tata Communications were the named partners5.
2019: entrepreneurial talent
The sixth edition, made with the Adecco Group, INSEAD and Tata Communications, was about entrepreneurial talent6. The variable count stayed at 68 and coverage rose from 119 to 125 countries, almost 98% of GDP and 93% of population6. It also modeled how to read change over time. Rather than compare year against year, it compared two three-year periods, 2014 to 2016 against 2017 to 2019, using only the 86 countries present in all six reports, which smooths annual noise and model changes6.
2020: artificial intelligence
The seventh edition took global talent in the age of artificial intelligence as its subject, following the path first explored in 20177. The model grew to 70 variables from 68 and coverage from 125 to 132 countries, 97% of GDP and 94% of population7. Three variables left and six came in, among them a new Technology Adoption component built from investment in emerging technologies and robot density7. The key message was that AI in the workplace requires a massive re-skilling of the workforce10. The partners named on the report were INSEAD, Adecco and Google7.
2021: COVID and a new production cycle
The eighth edition arrived in the fall rather than around Davos, and the pandemic forced a virtual launch8. It carried no external chapters because of the altered production cycle8. It was co-produced by INSEAD and the Portulans Institute, with Accenture as knowledge partner8. Four indicators came in, six were dropped and three replaced, leaving 68 variables, two fewer than in 2020, over 134 countries8. The audit found, for the first time, that every variable had a noteworthy impact on the variance of the index8. To soften the COVID effect, survey indicators from the World Economic Forum used a weighted four-year average rather than two years8.
2022: the tectonics of talent
The ninth edition asked whether the world is drifting towards greater talent inequalities10. HCLI, an early sponsor from 2013 to 2017, rejoined9. The model had 69 variables, one more than in 2021, and coverage slipped from 134 to 133 countries, almost 98% of GDP and more than 93% of population9. Eighteen countries moved ten places or more in the ranking that year, part of a run of greater fluctuations than usual that the 2023 report ties to COVID and to changes in the model10.
2023: ten years
The tenth anniversary edition, the 2023 report, changed little. One indicator left and one arrived, the total stayed at 69, and coverage rose from 133 to 134 countries with Uzbekistan joining for the first time10. Only two countries moved ten places or more, against 18 the year before10. The 2023 report doubles as a retrospective, and its findings fill a later section of this page. Every country, score and region of that edition is on the 2023 ranking page.
How the model and coverage changed
Three kinds of change run through the series: more indicators, more countries and a steady re-labelling of what counts as talent. The chart shows the first two; the table gives the third.
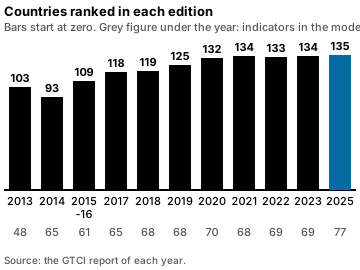
Worked example (our arithmetic). Subtract the previous edition’s indicator count from each edition’s count, using the figures each report prints for itself.
| Edition | Indicators | Change on previous edition | Population covered |
|---|---|---|---|
| 2013 | 481 | first edition1 | 86.3%1 |
| 2014 | 652 | up 171,2 | 83.8%2 |
| 2015-16 | 613 | down 42,3 | 87.4%3 |
| 2017 | 654 | up 43,4 | about 88.7%4 |
| 2018 | 685 | up 34,5 | 89%5 |
| 2019 | 686 | no change5,6 | 93%6 |
| 2020 | 707 | up 26,7 | 94%7 |
| 2021 | 688 | down 27,8 | more than 94%8 |
| 2022 | 699 | up 18,9 | more than 93%9 |
| 2023 | 6910 | no change9,10 | almost 94%10 |
The model moved in both directions, and the share of world GDP covered barely moved at all: 96.7% in 2013, 96.2% in 2014, 97% in 2015-16, 97.3% in 2017 and more than 97% in 20231,2,3,4,10. With the share of output flat, the added countries must be mostly small economies, not a larger slice of world output. Population coverage is the number that grew, from 83.8% in 2014 and 86.3% in 2013 to almost 94% in 20231,2,10.
Two of the changes matter beyond bookkeeping. In 2017 the new Employability sub-pillar put skill gaps and labour market mismatches inside the Output side of the model4. In 2020 Technology Adoption brought robot density and investment in emerging technologies into the Business and Labour Landscape7. Both are the model catching up with the theme of its own report. The methodology guide shows how the 77 indicators of the 2025 edition become one score11.
Who made the top three
Switzerland was first in all ten editions from 2013 to 202310. Singapore held second place in every one of those editions apart from 2020, when the United States took it10,7.
Worked example (our arithmetic). Count the podium places each country took across the eleven editions, 2013 to 2025, from the top-three column above and the 2025 table1,11.
| Country | First | Second | Third | Podium places |
|---|---|---|---|---|
| Switzerland | 1010 | 111 | 0 | 11 |
| Singapore | 111 | 910 | 17 | 11 |
| United States | 0 | 17 | 45,6,8,10 | 5 |
| Denmark | 0 | 0 | 31,9,11 | 3 |
| Luxembourg | 0 | 0 | 22,3 | 2 |
| United Kingdom | 0 | 0 | 14 | 1 |
The columns add up to 33 podium places, which is eleven editions times three. Only two editions broke the pattern of Switzerland first and Singapore second: 2020, when the United States took second place and Singapore fell to third, and 2025, when Singapore and Switzerland swapped7,11. For the margins behind this table, and why a gap of 0.15 points in 2025 is not a decisive win, read who led each edition.
The list beyond the podium is just as stable. Eighteen countries have appeared in a top 15 at least once across the ten editions, and 12 of them were in the top 15 every time10. Switzerland, Singapore and the United States formed the top three in half of all editions, the most common grouping of the decade10.
The city index that grew beside it
From 2017 the report carried a second ranking, of cities. The Global Cities Talent Competitiveness Index began with 46 cities in 34 countries4. It grew to some 90 cities in 20185 and to 114 in 2019, the third edition and the first with more than 100 cities6. The fourth edition in 2020 covered 155 cities in 75 economies, up from 114 cities in 64 economies7, and the fifth edition in 2021 kept the same 155 cities and 75 economies8.
| Edition | Cities | Note |
|---|---|---|
| 2017, first | 46 cities in 34 countries4 | Copenhagen, Zurich and Helsinki led4 |
| 2018, second | some 90 cities5 | |
| 2019, third | 114 cities6 | first edition with more than 1006 |
| 2020, fourth | 155 cities in 75 economies7 | up from 114 cities in 64 economies7 |
| 2021, fifth | 155 cities in 75 economies8 | same coverage as the year before8 |
Cities matter to the ten-year story. The 2023 report counts the rising role of cities and regions among six trends, and records that 56% of the world’s population lives in a city, up from 43% in 199010. The city index is a different instrument with its own data, and a city rank is not a country rank.
What ten editions agree on
The 2023 report closes the first decade with six trends from the data10:
- talent inequalities between countries remain high
- talent inequalities within countries are stubbornly persistent
- COVID has profoundly altered the global talent landscape
- cities and regions play increasingly important roles in talent initiatives
- growing uncertainties hamper brain circulation
- new generations are reshaping the world of work
The first is the best documented. The correlation between GDP per capita and GTCI score grew from 0.76 in 2013 to 0.85 in 202310. Income groups overlapped in 2013 and almost not at all in 202310. A reader who wants one sentence about the first decade of the index can use that one: the link between national income and the talent score strengthened.
An editor’s caution is in order. A rising correlation can come from the world or from a model that changed again and again, and the series cannot separate the two on its own. The 2023 report is careful here: a score that changes between years might primarily reflect a methodological adjustment rather than new data10.
Comparing editions without misleading yourself
Three habits keep an edition comparison honest.
- Use ranks and margins, not scores. Each edition rescales its model. The indicator count changed in seven of the nine steps from one edition to the next, and in 2023, one of the two steps that kept the count, one indicator was still swapped for another1,2,3,4,5,6,7,8,9,10. A score in one row says nothing about a score in another.
- Smooth before you conclude. The 2023 report averages scores across five years because averaging dampens the effect of model changes10. The 2019 report compared two three-year periods, using only countries present in all six reports so far6.
- Check the country list. The set of ranked countries changed in every edition: 103, 93, 109, 118, 119, 125, 132, 134, 133, 1341,2,3,4,5,6,7,8,9,10. A country that appears to fall may simply have a different set of neighbours.
The same discipline applies to titles. A rank is a statement about one edition, and the sentence it belongs in names that edition: “ranked first in the 2025 edition” is a fact about Singapore11, and “ranked first” on its own is not.
Who produced the reports
INSEAD released the index every year from 2013, and the partners changed around it10. The Human Capital Leadership Institute took part in 2013 to 2017 and again from 202210. The Adecco Group appears on the reports from 2014 to 20202,7. Tata Communications is named in 2018 and 20195,6, and Google in 20207. The Portulans Institute is named as a co-producer from 2021, with Accenture as knowledge partner that year8. The Descartes Institute for the Future has collaborated since 202110.
That timeline is worth checking against any claim that “the Adecco report” or “the Google report” is the GTCI: the partner on the cover changed more than once. It also exposes one conflict between sources. The 2025 edition presents its co-production with the Portulans Institute as a first11, while the 2021 report already named Portulans as co-producer8. The two cannot both be read literally. This page follows the 2021 report, which is earlier and specific.
The reports are free to read, and every edition is linked in the Sources list below. The 2021 edition was produced exclusively in electronic format and the 2022 edition almost exclusively, both free to access on sites hosted by INSEAD and the Portulans Institute8,9.
The gap in 2024 and the 2025 edition
There is no 2024 report. Following a one-year pause in 2024, the eleventh edition appeared in 202511. It carries 77 indicators, against 69 in 2023, for 135 countries11. The concepts and framework are largely the same as in 2023, and the additions include AI skills migration and employee wellbeing11. Singapore leads for the first time and Switzerland is second11.
For a reader who wants to put 2023 and 2025 side by side10,11, the safe comparison is rank against rank for the countries in both tables, with the model change flagged. The 2025 results page does that for the top 2511, and what the index measures explains the six pillars those ranks rest on.
RelatedWho led the GTCI, 2013 to 2025: Switzerland, then SingaporeGTCI 2017 results: top 25 ranking and findingsGTCI 2025 ranking: top 25 countries and scores
Sources
- The Global Talent Competitiveness Index 2013 (full report) · INSEAD and HCLI, GTCI 2013 · globaltalentcompetitivenessindex.org · checked October 21, 2026
- The Global Talent Competitiveness Index 2014: Growing talent for today and tomorrow · INSEAD, Adecco Group and HCLI, GTCI 2014 · globaltalentcompetitivenessindex.org · checked October 21, 2026
- The Global Talent Competitiveness Index 2015-16: Talent attraction and international mobility · INSEAD, Adecco Group and HCLI, GTCI 2015-16 · globaltalentcompetitivenessindex.org · checked October 21, 2026
- The Global Talent Competitiveness Index 2017: Talent and technology · INSEAD, Adecco Group and HCLI, GTCI 2017 · globaltalentcompetitivenessindex.org · checked October 21, 2026
- The Global Talent Competitiveness Index 2018: Diversity for competitiveness · INSEAD, Adecco Group and Tata Communications, GTCI 2018 · globaltalentcompetitivenessindex.org · checked October 21, 2026
- The Global Talent Competitiveness Index 2019: Entrepreneurial talent and global competitiveness · INSEAD, Adecco Group and Tata Communications, GTCI 2019 · globaltalentcompetitivenessindex.org · checked October 21, 2026
- The Global Talent Competitiveness Index 2020: Global talent in the age of artificial intelligence · INSEAD, the Adecco Group and Google, GTCI 2020 · globaltalentcompetitivenessindex.org · checked October 21, 2026
- The Global Talent Competitiveness Index 2021: Talent competitiveness in times of COVID-19 · INSEAD, Portulans Institute and Accenture, GTCI 2021 · globaltalentcompetitivenessindex.org · checked October 21, 2026
- The Global Talent Competitiveness Index 2022: The tectonics of talent · INSEAD, Portulans Institute and partners, GTCI 2022 · globaltalentcompetitivenessindex.org · checked October 21, 2026
- The Global Talent Competitiveness Index 2023: What a difference ten years make · INSEAD, Descartes Institute for the Future and partners, GTCI 2023 (copy hosted by InvestChile) · investchile.gob.cl · checked October 21, 2026
- Global Talent Competitiveness Index 2025: Talent and resilience · INSEAD and Portulans Institute, GTCI 2025 · portulansinstitute.org · checked October 21, 2026
Image credits (2)
Published . Rankings change with every edition: each figure names its edition year and each source shows the day it was checked. How we check facts · Report an error.