On this page
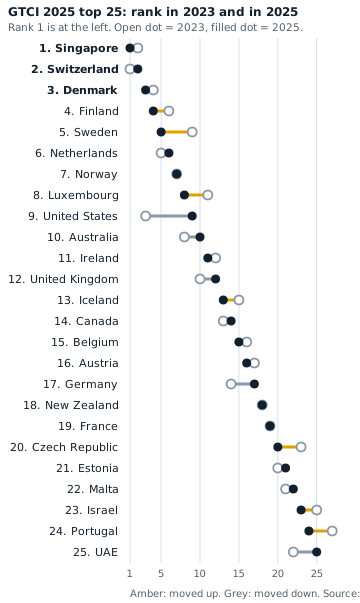
The 2025 edition is the first in which Singapore leads, and it is also the first built on the revised model that adds AI adoption, workforce resilience and employee wellbeing1. That makes it two stories: a new order at the top and a new yardstick underneath. This page gives the full top 25 first, then the pillar leaders, the movement against the 2023 edition and the cautions that go with any comparison.
The 2025 ranking: top 25 of 135
Table 1 of the GTCI 2025 report lists every country with its score, income group and region1. The first 25 rows are reproduced here as printed; every one of them is in the high-income group1. Norway and Luxembourg share the printed score 69.84 and the report ranks them 7th and 8th1.
| Rank | Country | Score | Region |
|---|---|---|---|
| 1 | Singapore | 73.29 | Eastern, Southeastern Asia and Oceania1 |
| 2 | Switzerland | 73.14 | Europe1 |
| 3 | Denmark | 72.05 | Europe1 |
| 4 | Finland | 71.06 | Europe1 |
| 5 | Sweden | 70.76 | Europe1 |
| 6 | Netherlands | 70.26 | Europe1 |
| 7 | Norway | 69.84 | Europe1 |
| 8 | Luxembourg | 69.84 | Europe1 |
| 9 | United States of America | 69.41 | Northern America1 |
| 10 | Australia | 69.27 | Eastern, Southeastern Asia and Oceania1 |
| 11 | Ireland | 68.73 | Europe1 |
| 12 | United Kingdom | 67.52 | Europe1 |
| 13 | Iceland | 66.63 | Europe1 |
| 14 | Canada | 66.40 | Northern America1 |
| 15 | Belgium | 66.05 | Europe1 |
| 16 | Austria | 65.86 | Europe1 |
| 17 | Germany | 65.73 | Europe1 |
| 18 | New Zealand | 64.16 | Eastern, Southeastern Asia and Oceania1 |
| 19 | France | 62.88 | Europe1 |
| 20 | Czech Republic | 62.52 | Europe1 |
| 21 | Estonia | 61.92 | Europe1 |
| 22 | Malta | 60.97 | Europe1 |
| 23 | Israel | 60.16 | Northern Africa and Western Asia1 |
| 24 | Portugal | 59.90 | Europe1 |
| 25 | United Arab Emirates | 59.36 | Northern Africa and Western Asia1 |
Europe holds 18 of the top 25 places, and the non-European members are Australia, Canada, New Zealand, Israel and the United Arab Emirates, plus Singapore and the United States at the top1. South Korea left this group and Portugal entered it for the first time1. The gap is steep after the top ten: from 10th to 25th the score falls from 69.27 to 59.36, about ten points over fifteen places, while the first ten places cover only about four points1.
The top ten countries in the GTCI 2025 ranking
Singapore is first, Switzerland second, Denmark third, Finland fourth, Sweden fifth, the Netherlands sixth, Norway seventh, Luxembourg eighth, the United States ninth and Australia tenth1. Singapore’s lead over Switzerland is 73.29 to 73.14, and Switzerland’s over Denmark is 73.14 to 72.051. The top two are separated by less than the gap between second and third.
Three patterns run through the ten. High-income economies dominate, and European countries, especially the Nordics, perform strongly across several dimensions1. Several countries win on one specialism: the Netherlands leads in growing talent, Luxembourg in attracting it1. And all ten do well on both enablement and Generalist Adaptive Skills1. Seven of the ten are European1.
An editor’s reading: the top ten is a club with one stable trait, a strong enabling environment. What distinguishes members is the second trait. Denmark, Finland and Switzerland rank near the top on enabling and retaining talent1, Luxembourg on attracting it, Singapore on high-level skills1. That is why a single rank hides more than it shows, and why the pillar table below matters.
Pillar leaders in GTCI 2025
The overall index averages six pillars: Enable, Attract, Grow and Retain on the input side, Vocational and Technical (VT) Skills and Generalist Adaptive (GA) Skills on the output side3. Each pillar has its own leader, and the leaders are not the overall top three.
| Pillar | 1st | 2nd | 3rd |
|---|---|---|---|
| Enable | Denmark | Finland | Switzerland1 |
| Attract | Luxembourg | Singapore | United Arab Emirates1 |
| Grow | Netherlands | United States | United Kingdom1 |
| Retain | Norway | Sweden | Denmark1 |
| VT Skills | Czech Republic | United States | Switzerland1 |
| GA Skills | Singapore | Israel | Ireland1 |
These ranks come from the report’s table of rankings by pillar1. Four pillar leaders sit outside the overall top three: Luxembourg (8th overall), the Netherlands (6th), Norway (7th) and the Czech Republic (20th)1. Israel (23rd overall), the United Arab Emirates (25th) and Ireland (11th) each place second or third on a pillar1. Singapore is the only country that leads both a pillar and the overall ranking.
The pillar tables also show what the leaders lack. Denmark leads Enable yet ranks 10th on both Attract and Grow1. Switzerland has all six pillars inside the top ten, with Enable and VT Skills, both 3rd, its strongest1. A country with no pillar lead can still rank near the top by being solid everywhere.
What changed since the 2023 edition
The index skipped 2024. Following a one-year pause, the 2025 edition arrived with a revised model, and the report asks readers to treat comparisons with earlier editions cautiously1. Ranks are the safer thing to compare, and only roughly.
Worked example (our arithmetic). The table subtracts each 2025 rank from the 2023 rank, both read from the published tables1,2.
| Country | 2025 rank | 2023 rank | Change |
|---|---|---|---|
| Singapore | 1 | 2 | up 11,2 |
| Switzerland | 2 | 1 | down 11,2 |
| Denmark | 3 | 4 | up 11,2 |
| Finland | 4 | 6 | up 21,2 |
| Sweden | 5 | 9 | up 41,2 |
| Netherlands | 6 | 5 | down 11,2 |
| Norway | 7 | 7 | no change1,2 |
| Luxembourg | 8 | 11 | up 31,2 |
| United States | 9 | 3 | down 61,2 |
| Australia | 10 | 8 | down 21,2 |
| Ireland | 11 | 12 | up 11,2 |
| United Kingdom | 12 | 10 | down 21,2 |
| Iceland | 13 | 15 | up 21,2 |
| Canada | 14 | 13 | down 11,2 |
| Belgium | 15 | 16 | up 11,2 |
| Austria | 16 | 17 | up 11,2 |
| Germany | 17 | 14 | down 31,2 |
| New Zealand | 18 | 18 | no change1,2 |
| France | 19 | 19 | no change1,2 |
| Czech Republic | 20 | 23 | up 31,2 |
| Estonia | 21 | 20 | down 11,2 |
| Malta | 22 | 21 | down 11,2 |
| Israel | 23 | 25 | up 21,2 |
| Portugal | 24 | 27 | up 31,2 |
| United Arab Emirates | 25 | 22 | down 31,2 |
Of these 25 countries, 12 moved up, 10 moved down and 3 held the same rank1,2. The headline moves are these.
Singapore up one place, Switzerland down one. Singapore rose from 2nd to 1st and Switzerland fell from 1st to 2nd, its first time off the top in the index’s history1,2. The 2025 report adds that Singapore’s advance came mainly from Retain, 31st, up from 38th, and from Lifestyle, 32nd, up from 49th1.
The United States down six places. It fell from 3rd to 9th, outside the top five for the first time since the 2013 edition1. One other passage of the 2025 report gives a later year instead; the earlier editions’ own tables, set out in who led each edition, do not support it, so this site uses 20131. The drivers are weaker GA Skills (13th, down from 5th), Attract (28th, down from 22nd) and Enable (7th, down from 4th)1.
Sweden up four, Luxembourg up three. Sweden’s four-place climb is the largest among the top fifteen, and Luxembourg returned to the top ten for the first time since 20211.
South Korea out, Portugal in. Korea ranked 24th in 2023 and 31st in 2025, with the report pointing to Grow, Retain and VT Skills1,2. Portugal moved from 27th to 24th1,2.
Why Singapore ranks first
Singapore’s pillar profile is lopsided, and that is the story of the 2025 result. It is first in GA Skills, Formal Education and the Regulatory Landscape1. It is second in Attract and fourth in Enable1. On Retain it is only 31st, and its VT Skills slipped to 13th from 3rd1.
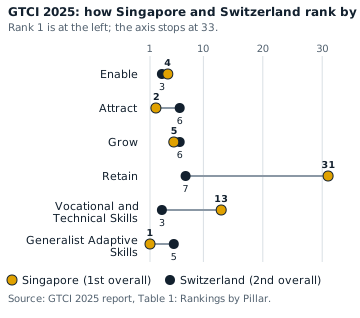
Switzerland has the opposite shape: nothing worse than 7th, nothing first1. Singapore is ahead on Attract (2nd against 6th), Grow (5th against 6th) and GA Skills (1st against 5th); Switzerland is ahead on Enable (3rd against 4th), Retain (7th against 31st) and VT Skills (3rd against 13th)1. High-level skills look decisive. Australia (10th overall) and New Zealand (18th) score higher than Singapore in retaining talent but trail it overall because of Singapore’s much higher ranking in GA Skills1. For Singapore and its region the result is a defining milestone3.
Regional picture in GTCI 2025
Europe accounts for 18 of the top 25 and leads the 2025 table; Switzerland, Denmark and Finland are close behind one another in the top four1. Northern America is represented by the United States (9th) and Canada (14th), and Canada ranks ahead of the United States on attracting talent1.
East, Southeast Asia and Oceania has Singapore at the top, with Australia 10th and New Zealand 18th; the GTCI site says both outperform expectations for their income levels1,3. Northern Africa and Western Asia is led by Israel at 23rd, with the United Arab Emirates 25th; the UAE ranks 3rd worldwide on Attract, behind Luxembourg and Singapore1,3. Latin America and the Caribbean is led by Chile at 39th1.
China is 53rd, and data availability likely played the most important role in the move: China did not take part in the 2025 World Economic Forum Executive Opinion Survey1. Read that rank as a coverage effect as much as a performance one.
How to read the 2025 scores
Scores belong to their edition. The 2025 model has 77 indicators across 135 countries, representing over 97% of global GDP and 93% of the world’s population1. Because the model changed, Singapore’s 73.29 in 2025 cannot be set against a leader’s score from an older edition1; the story of who led each edition shows why.
Three habits help:
- Quote the edition year with every rank, as in first in GTCI 20251, not just first.
- Compare ranks across editions only with a warning, and scores never1.
- Remember the strong positive correlation between GDP per capita and GTCI scores, so the useful question is who beats their income1.
The European Commission’s Joint Research Centre audits each edition independently1. The 2023 report and the index website hold the prior edition and the 2025 key messages2,3. The audit tests the arithmetic, not whether 77 indicators cover everything about talent. For how the scores are built, read what the index measures. For a different ranking with a different method, the IMD World Talent Ranking 2025 covers 69 economies4. For the older scale, see the 2017 results, and the rankings hub lists every edition.
Common questions
Which country has the most talented people?
In the GTCI 2025 edition, Singapore ranks first overall with 73.29 and first on Generalist Adaptive Skills, the pillar for high-level skills1. The index scores how well a country develops, attracts and retains talent; it does not count talented people.
Which country topped the Global Competitiveness Index?
In the World Economic Forum's 2019 edition, Singapore, with a score of 84.8 out of 1005. That index scores whole economies. The GTCI is a separate index of talent, and its 2025 edition also puts Singapore first1.
Which countries are most competitive?
For talent, the GTCI 2025 top three are Singapore, Switzerland and Denmark1. For whole economies the answer comes from other indexes, so name the index and the edition before naming a country.
RelatedWho led the GTCI, 2013 to 2025: Switzerland, then SingaporeWhat is the Global Talent Competitiveness Index (GTCI)?GTCI 2017 results: top 25 ranking and findings
Sources
- Global Talent Competitiveness Index 2025: Talent and resilience · INSEAD and Portulans Institute, GTCI 2025 · portulansinstitute.org · checked October 21, 2026
- The Global Talent Competitiveness Index 2023: What a difference ten years make · INSEAD, Descartes Institute for the Future and partners, GTCI 2023 (copy hosted by InvestChile) · investchile.gob.cl · checked October 21, 2026
- Global Talent Competitiveness Index: GTCI 2025 key messages · GTCI website (INSEAD and Portulans Institute) · globaltalentcompetitivenessindex.org · checked October 21, 2026
- World Talent Ranking 2025 · IMD World Competitiveness Center · imd.org · checked October 21, 2026
- The Global Competitiveness Report 2019 · World Economic Forum · www3.weforum.org · checked October 21, 2026
Image credits (2)
Published . Rankings change with every edition: each figure names its edition year and each source shows the day it was checked. How we check facts · Report an error.