On this page
- The structure: five levels from indicator to index
- Where the 77 indicators come from
- Which countries get in: coverage rules
- Missing data and outliers
- Normalisation: turning raw values into 0 to 100
- Aggregation and weights
- The JRC audit
- Robustness: 1,000 simulations and alternative models
- How the model has changed, 2013 to 2025
- Why scores and ranks do not carry across editions
- Using the method well
A GTCI rank is the end of a chain of modelling choices: which indicators to use, which countries to include, what to do about gaps and outliers, how to rescale, how to weight. This page follows the chain in order, using the 2025 edition’s technical appendix and the European Commission’s audit of it1. Where arithmetic helps, it is shown with invented numbers and labelled as ours.
The structure: five levels from indicator to index
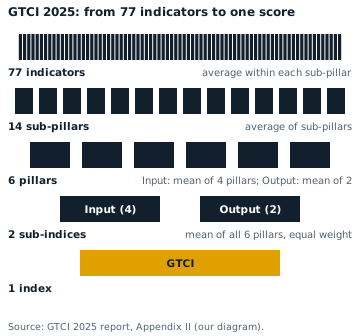
The GTCI is an Input-Output model. It combines an assessment of what countries do to produce and acquire talent, the Input, with the skills available as a result, the Output1. Its Input pillars are inspired by the attract-grow-retain framework that corporations use to steer talent management1. The GTCI site describes the core as a six-pillar Input-Output framework7.
| Level | Count in 2025 | How it is built |
|---|---|---|
| Indicators | 77 | Rescaled raw data1 |
| Sub-pillars | 14 | Simple average of three to seven indicators1 |
| Pillars | 6 | Simple average of two to three sub-pillars1 |
| Sub-indices | 2 | Input is the mean of four pillars, Output the mean of two1 |
| Overall GTCI | 1 | Simple average of the six pillars1 |
The 2025 edition groups its 77 indicators into 14 sub-pillars, six pillars, two sub-indices and an overall index for 135 countries1. The pillars guide walks through what each pillar contains.
Where the 77 indicators come from
The indicators fall into three kinds1.
Worked example (our arithmetic). The three categories add up to the full set:
| Kind of data | Indicators | Typical sources |
|---|---|---|
| Hard, quantitative data | 401 | UNESCO, ILO, World Bank, OECD, The Conference Board1 |
| Index or composite indicators | 151 | World Bank governance data, Transparency International, Social Progress Index, Yale and Columbia’s Environmental Performance Index1 |
| Survey, qualitative data | 221 | Mainly the World Economic Forum’s Executive Opinion Survey1 |
| Total | 77 (40 + 15 + 22)1 |
Indices inside an index are a known risk. There are two concerns: doubts about the methodology that produced each single score, and the risk of duplicating indicators1. The GTCI team judged the gains outweighed the downsides and included only indices that publish their methodology transparently and are widely well received, and only those with a narrow focus, to avoid double-counting1.
Survey data fills the gaps where hard data are thin. Qualitative information tends to give the most current assessment of areas for which hard data do not exist or have low country coverage1. Survey participation therefore matters: China did not take part in the 2025 Executive Opinion Survey, and its 2025 rank carries that data caveat1.
Which countries get in: coverage rules
Availability tests decide what enters the 2025 edition1.
- A country needs aggregate availability of at least 70%, which is 54 of 77 indicators, and at least 40% at sub-pillar level1.
- An indicator needs data for at least 50% of countries, 68 of 1351.
- The most recent data point per country counts, with 2014 as the cut-off year1.
Two indicators are exempt from the 50% rule: AI skills migration and AI talent concentration, whose data coverage is 34.8%, or 47 of 135 countries1. They were added for their contextual and theoretical significance within the framework1. The result is a dataset with 92.3% data coverage1.
The 135 countries represent over 97% of global GDP and 93% of the world’s population1. The first edition, in 2013, covered 103 countries, 86.3% of the world’s population and 96.7% of its GDP4.
Missing data and outliers
The GTCI does not fill gaps. There was no imputation of missing values, which are marked n/a and left out of sub-pillar scores1. Only 7.7% of the data were missing1. The effect of that choice is that, in an arithmetic average, a missing indicator is equivalent to replacing it with the mean of the other indicators being aggregated1.
Outliers get a rule-based treatment. An absolute skewness above 2 or kurtosis above 3.5 flags an outlier problem1. Indicators with up to five outliers are winsorized, where the extreme value is reassigned to the next highest or lowest value, and indicators with six or more outliers are transformed with natural logarithms1. If logarithms are ineffective, the Yeo-Johnson transformation is applied1. The 2025 edition adopted Yeo-Johnson in line with the JRC’s recommendations1.
In 2025 outliers were detected in ten indicators1. Seven had fewer than six outliers, two were log-transformed and one went through the Yeo-Johnson transformation1.
Normalisation: turning raw values into 0 to 100
To make indicators comparable, the GTCI applies min-max normalisation so all values fall in the 0 to 100 range1. Where higher values mean worse outcomes, a reverse formula is applied1. Some index-based and survey-based indicators keep their original range as the minimum and maximum, for example 1 to 7 for the World Economic Forum survey questions and 0 to 100 for the Yale Environmental Performance Index1.
Worked example (our arithmetic). The standard forms are written out here with invented indicators; the reverse form applies where higher values mean worse outcomes1. Higher is better: score = 100 x (value - min) / (max - min). Lower is better: score = 100 x (max - value) / (max - min).
| Invented indicator | Range | Value | Calculation | Score |
|---|---|---|---|---|
| Share of firms offering training (higher is better) | 10 to 90 | 74 | 100 x (74 - 10) / (90 - 10)1 | 80 |
| Youth unemployment (lower is better) | 2 to 22 | 6 | 100 x (22 - 6) / (22 - 2)1 | 80 |
| Survey item on a 1 to 7 scale | 1 to 7 | 5.5 | 100 x (5.5 - 1) / (7 - 1)1 | 75 |
The survey row uses the original range, 1 to 7, as the goalposts rather than the lowest and highest answers in the sample1. Using the sample’s own minimum and maximum would give a different score, and the JRC tested exactly that alternative in its robustness analysis1.
Aggregation and weights
Pillars carry equal weight. All six pillars are assigned equal weights when aggregated to the GTCI1. That choice is a design principle, not a finding: the weights test below varies them.
Equal pillar weights give unequal side weights. With four Input pillars and two Output pillars, the Input sub-index has a weight of 67% and the Output sub-index 33%1.
Worked example (our arithmetic). Weight of a side = number of its pillars / six:
Yet the audit finds both sub-indices matter equally in practice: the correlations between the GTCI and the Input sub-index and between the GTCI and the Output sub-index are both 0.981. A weight is not an importance, because the correlation structure and variances of the indicators also shape what an indicator contributes1. The six pillars correlate with the GTCI between 0.87 (Attract) and 0.95 (Retain), which indicates a balanced contribution1.
The JRC audit
The European Commission’s Joint Research Centre has been invited to evaluate the statistical properties of the GTCI since its inaugural release in 20131. The 2025 review is its eleventh assessment, carried out in October-November 20251. Its two questions are how coherent the structure is and how much the modelling assumptions move scores and ranks1.
On coherence the audit finds a Cronbach’s alpha of 0.96, well above the 0.70 threshold for a reliable aggregate1. A principal component analysis finds a single statistical dimension in each of the six pillars, capturing between 79% (Attract) and 92% (Retain) of the variance in their indicators1. Sub-pillars correlate more with their own pillar than with any other1. The 2017 audit gave an alpha of 0.953.
The conclusion is that the 2025 framework is robust and reliable, with a statistically coherent and balanced multi-level structure1. The audit also reports that between 33% and 60% of countries rank differently on the GTCI than on each of the six pillars, which is the case for using a composite1.
Robustness: 1,000 simulations and alternative models
The JRC tests how much rankings depend on modelling choices, using a Monte Carlo experiment combined with alternative models on four choices: pillar weights, normalisation, missing data and the aggregation formula1.
- Weights. 1,000 runs, each with a different set of pillar weights drawn at random1. Input pillars vary between 15% and 35%, Output pillars between 40% and 60% within their sub-indices, and for the GTCI each of the six weights varies between 6% and 26%1.
- Aggregation. The arithmetic mean assumes perfect compensability between outstanding and weak results, so the JRC also tries generalized means with p of 0.75, 0.5 and 0.251.
- Missing data and normalisation. Sixteen models combine no imputation against a five-nearest-neighbours estimate, arithmetic against the generalized means, and normalisation with and without the original-range exception1.
The results are reassuring but not trivial. All published ranks sit inside the simulated intervals, and the interval is 10 positions or fewer for 71 percent of countries1. For 85 percent of countries the published rank is within three positions of the simulated median1. Robustness is about the same as in the 2023 edition1.
Read that last result as a limit. A rank can move by a few places under reasonable alternative assumptions, so a one- or two-place gap between neighbours is weak evidence of anything. The story of who led each edition applies this to the closest first-place margins.
How the model has changed, 2013 to 2025
The 2017, 2023 and 2025 editions all group their indicators into 14 sub-pillars and six pillars, while the indicator set has been revised in most editions3,2,1.
| Edition | Indicators | Countries |
|---|---|---|
| 2013 | 484 | 1034 |
| 2017 | 653 | 1185 |
| 2018 | 685 | 1195 |
| 2020 | 706 | 1326 |
| 2023 | 692 | 1342 |
| 2025 | 771 | 1351 |
The 2020 edition added a Technology adoption component that measures how countries use and invest in new technologies, including AI6. The 2025 edition added AI adoption, workforce resilience and employee wellbeing, and renamed Global Knowledge Skills as Generalist Adaptive Skills1. The 2023 report marks the tenth annual edition and the 2025 edition the eleventh2,1. A pause in 2024 preceded the revisions1.
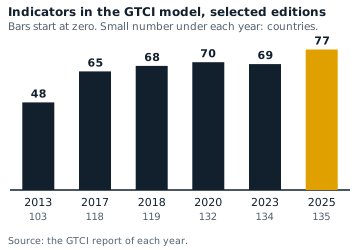
The 2023 count fell by one from 20202,6. Counts also depend on naming: the 2013 to 2020 reports call the items variables or indicators interchangeably4,3,5,6.
Why scores and ranks do not carry across editions
Scores and rankings are not directly comparable between one year and another1. Each ranking reflects the framework, the data coverage and the country sample of that edition1. Three kinds of change move a rank without any change in the economy1:
- Adjustments to the framework, meaning changes in indicator composition and measurement revisions.
- Data updates, outlier treatment and missing values.
- The inclusion or exclusion of economies in the sample.
Four further characteristics complicate any time series1.
- Missing values. The GTCI produces relative scores, so a missing value for one economy affects the scores of others1.
- Reference year. The data refer to several years, depending on the latest available year for each variable1.
- Normalisation factor. Most variables are scaled by GDP, population or another factor, so a year-on-year change may come from the numerator or the denominator1.
- Consistent collection. Changes in the definition of variables or in the data collection process can create movements unrelated to performance1.
The practical rule: compare a country’s rank across editions only with the warning that the model changed, and never compare scores. The 2025 results page applies this to the leading countries1.
Using the method well
- Name the edition: GTCI 2025, 77 indicators, 135 countries1.
- Report a rank with its pillar context, because overall and pillar ranks differ for 33% to 60% of countries1.
- Treat neighbours within a few places as a tie, in line with the audit’s three-position band1.
- Check which indicators changed before attributing a rank move to policy1.
For the plain-English overview, see what the GTCI is; the method hub lists every page on how the index works. The full technical appendix and the audit chapter are in the 2025 report.
Common questions
What is the Global Talent Competitiveness Index (GTCI)?
An annual composite index of national talent competitiveness. The 2025 edition combines 77 indicators across 135 countries, joining what countries do to produce and acquire talent with the skills available as a result1.
Which country is very talented?
In the GTCI 2025 edition Singapore ranks first, with Switzerland second1. That is a position on the model's indicators for national talent competitiveness, not a measure of any one population's ability.
Which 10 countries have the most talented people?
In GTCI 2025: Singapore, Switzerland, Denmark, Finland, Sweden, the Netherlands, Norway, Luxembourg, the United States and Australia, in that order1.
RelatedWhat is the Global Talent Competitiveness Index (GTCI)?GTCI pillars: Enable, Attract, Grow, Retain, VT and GAGTCI 2025 ranking: top 25 countries and scores
Sources
- Global Talent Competitiveness Index 2025: Talent and resilience · INSEAD and Portulans Institute, GTCI 2025 · portulansinstitute.org · checked October 21, 2026
- The Global Talent Competitiveness Index 2023: What a difference ten years make · INSEAD, Descartes Institute for the Future and partners, GTCI 2023 (copy hosted by InvestChile) · investchile.gob.cl · checked October 21, 2026
- The Global Talent Competitiveness Index 2017: Talent and technology · INSEAD, Adecco Group and HCLI, GTCI 2017 · globaltalentcompetitivenessindex.org · checked October 21, 2026
- The Global Talent Competitiveness Index 2013 (full report) · INSEAD and HCLI, GTCI 2013 · globaltalentcompetitivenessindex.org · checked October 21, 2026
- The Global Talent Competitiveness Index 2018: Diversity for competitiveness · INSEAD, Adecco Group and Tata Communications, GTCI 2018 · globaltalentcompetitivenessindex.org · checked October 21, 2026
- The Global Talent Competitiveness Index 2020: Global talent in the age of artificial intelligence · INSEAD, the Adecco Group and Google, GTCI 2020 · globaltalentcompetitivenessindex.org · checked October 21, 2026
- Global Talent Competitiveness Index: GTCI 2025 key messages · GTCI website (INSEAD and Portulans Institute) · globaltalentcompetitivenessindex.org · checked October 21, 2026
Image credits (2)
Published . Rankings change with every edition: each figure names its edition year and each source shows the day it was checked. How we check facts · Report an error.