On this page
- The six pillars at a glance
- How the pillars fit together
- Enable: the conditions for talent
- Attract: openness in two directions
- Grow: more than schooling
- Retain: keeping the talent you have
- VT Skills: mid-level skills and employability
- GA Skills: adaptability, soft skills and high-level work
- Pillar leaders in GTCI 2025
- What changed in the pillars between editions
- Who builds the pillars: INSEAD, Portulans and the JRC audit
- Reading a pillar rank without misreading it
A pillar rank is the most quoted number after the overall rank, and the most misread. Each pillar is a bundle of indicators with its own logic, its own leaders and its own blind spots, and the overall score is only their plain average. This guide goes through the pillars in turn, with the sub-pillars and indicators beneath them and the countries that led each in the 2025 edition1.
The six pillars at a glance
Four pillars describe what a country does, called Input, and two describe the skills it ends up with, called Output1. Enable, Attract, Grow and Retain are the Input pillars; VT Skills and GA Skills are the Output pillars1.
| Pillar | Side | Sub-pillars | The question it asks |
|---|---|---|---|
| Enable | Input | Regulatory Landscape, Market Landscape, Business & Labour Landscape | Do regulation, markets and workplaces create a climate where talent can develop and thrive?1 |
| Attract | Input | External Openness, Internal Openness | Does the country draw in foreign investment and skilled people, and open its own talent pool to excluded groups?1 |
| Grow | Input | Formal Education, Lifelong Learning, Access to Growth Opportunities | Does education extend to training, continuous learning and growth opportunities?1 |
| Retain | Input | Sustainability, Lifestyle | Is it a place where talented people choose to stay?1 |
| Vocational and Technical (VT) Skills | Output | Mid-level Skills, Employability | How strong are mid-level technical and professional skills, and how well do they match jobs?1 |
| Generalist Adaptive (GA) Skills | Output | High-level Skills, Talent Impact | How strong are high-level, adaptable skills, and what do they produce?1 |
Each pillar holds two to three sub-pillars, and each sub-pillar three to seven indicators1. The 2025 edition groups 77 indicators into 14 sub-pillars and six pillars for 135 countries1. The next section counts how they divide.
How the pillars fit together
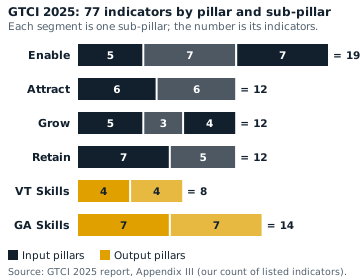
Worked example (our arithmetic). Counting the indicators listed under each pillar in Appendix III of the 2025 report gives this split1:
| Pillar | Sub-pillars | Indicators |
|---|---|---|
| Enable | 3 | 191 |
| Attract | 2 | 121 |
| Grow | 3 | 121 |
| Retain | 2 | 121 |
| VT Skills | 2 | 81 |
| GA Skills | 2 | 141 |
| Total | 14 | 771 |
The unequal counts do not make the pillars unequal. All six pillars are assigned equal weights when they are aggregated into the index1. A pillar with eight indicators moves the overall score exactly as much as one with nineteen. Because scores are averaged at each level, a single VT Skills indicator therefore carries more weight than a single Enable indicator, an inference from the averaging rules1.
Worked example (our arithmetic). Take six invented pillar scores and combine them the way the index does1:
| Step | Calculation | Result |
|---|---|---|
| Input sub-index | (80 + 60 + 70 + 50) / 41 | 65 |
| Output sub-index | (30 + 80) / 21 | 55 |
| Overall index | (80 + 60 + 70 + 50 + 30 + 80) / 61 | 61.7 |
The overall result is not the midpoint of the two sub-indices, which would be 60. Four of the six pillars are Input pillars, so the Input side carries a weight of 67% and the Output side 33%, even though each pillar counts equally1.
The statistics support the design. Each pillar’s indicators share one statistical dimension, which captures between 79% (Attract) and 92% (Retain) of their variance1. Sub-pillars are more correlated with their own pillar than with any other1. Attract has the lowest correlation with the overall GTCI at 0.87 and Retain the highest at 0.951.
Enable: the conditions for talent
Enable reflects how far the regulatory and business environments, including competition, management practices and the working of labour markets, create a favourable climate for talent to develop and thrive1. It has three sub-pillars: Regulatory Landscape, Market Landscape and Business & Labour Landscape1.
The indicators mix governance scores and plain infrastructure counts. Regulatory Landscape draws on perception indicators for government effectiveness, rule of law, political stability and regulatory quality1. Market Landscape includes domestic credit to the private sector, R&D expenditure, 3G coverage and internet access in schools1. Business & Labour Landscape includes national compliance with labour rights and labour-employer cooperation1.
In 2025 Denmark ranks first on Enable, Finland second and Switzerland third; Singapore is fourth1. Denmark’s Regulatory Landscape and Business and Labour Landscape both rank second1. Finland’s Enable rank is anchored in governance, with rule of law first and corruption control second1.
Germany’s Enable rank fell to 16th from 10th, driven mainly by the Market Landscape, which dropped to 27th from 12th1. The United States slipped on Enable too, to 7th from 4th1.
Attract: openness in two directions
Attract looks outward and inward. Externally it measures the draw of foreign resources: productive businesses through foreign direct investment, and creative people through high-skilled migration1. Internally it measures removal of barriers for groups such as the underprivileged, women and non-native people1. The two sub-pillars are External Openness and Internal Openness1.
External Openness includes financial globalisation, migrant stock and international students1. Internal Openness includes tolerance of minorities, economic empowerment of women and gender parity in high-skilled jobs1. The AI skills migration indicator, which sits in External Openness, is one of two indicators covered for only about 35% of countries1.
Luxembourg leads Attract in 2025, Singapore is second and the United Arab Emirates third1. Luxembourg’s lead rests on External Openness, where it also ranks first1. The GTCI site adds that five of the top ten economies in External Openness come from Northern Africa and Western Asia4. The United States fell on this pillar, to 28th from 22nd1. China’s Attract result weakened because of FDI restrictions and declining financial globalisation1.
Grow: more than schooling
Growing talent used to mean education. The index definition now includes apprenticeships, training and continuous education, plus experience and access to growth opportunities1. Its three sub-pillars are Formal Education, Lifelong Learning and Access to Growth Opportunities1.
Formal Education draws on vocational and tertiary enrolment, PISA scores in reading, mathematics and science, and the average score of a country’s top universities1. Lifelong Learning includes business masters education and the share of firms offering formal training1. Access to Growth Opportunities includes the share of young people not in education, employment or training1.
The Netherlands leads Grow in 2025, the United States is second and the United Kingdom third1. The Netherlands is first on the pillar while ranking 6th overall, with strong results in Access to Growth Opportunities (3rd) and Formal Education (4th)1. Grow (3rd) and GA Skills (6th) are among the United Kingdom’s leading pillars1. Korea’s slide out of the top 25 included Grow, where it fell to 33rd from 28th and Lifelong Learning dropped to 55th from 35th1.
Retain: keeping the talent you have
Retaining talent matters because the more talented the person, the wider the global opportunities available to them1. The pillar has two components: sustainability, both personal and national, and quality of life1. The sub-pillars are Sustainability and Lifestyle1.
Sustainability includes pension coverage, environmental performance and vulnerable employment1. Lifestyle includes personal rights, physician density and sanitation1. The 2025 edition added household financial resilience, protection against future disasters and employee wellbeing1. High-income economies, particularly the Nordics, lead on household financial resilience4.
Norway leads Retain in 2025, Sweden is second and Denmark third1. Norway’s first place is anchored in Sustainability (1st) and universal pension coverage (1st)1.
Retain is also where the most surprising 2025 result sits. Singapore ranks first overall but only 31st on Retain, up from 38th, helped by personal rights, physician density and personal safety1. A country can lead the index with a weak Retain pillar if the skills pillars carry it.
VT Skills: mid-level skills and employability
Mid-level skills, labelled VT Skills, are technical or professional skills acquired through vocational or professional training and experience1. Their impact is measured through employability: indicators around skills gaps and labour market mismatches, and the adequacy of education systems1. The sub-pillars are Mid-level Skills and Employability1.
Mid-level Skills includes the workforce and population with secondary education, technicians and associate professionals, and labour productivity per employee1. Employability includes skills matching, the share of workers whose education matches their occupation, and highly educated unemployment1. The lowest correlation between any sub-pillar and its pillar is 0.82, between Employability and VT Skills1.
The Czech Republic leads VT Skills in 2025, the United States is second and Switzerland third1. Germany’s strongest pillar is VT Skills at 5th, supported by technicians and associate professionals at 2nd1. Singapore’s VT Skills fell to 13th from 3rd, a decline the index links to emerging pressures in mid-level skills and employability1. Chile, 39th overall, leads Latin America and the Caribbean on a strong foundation in mid-level skills1.
GA Skills: adaptability, soft skills and high-level work
In 2025 the former Global Knowledge Skills pillar was relabelled Generalist Adaptive Skills, to better represent the broad-based and collaborative skill sets that contemporary labour markets increasingly demand1. The 2017 edition called it Global Knowledge Skills, the sixth pillar2. High-level skills here means the creativity and problem-solving required of workers in professional, managerial or leadership roles, and their economic impact is evaluated through innovation, entrepreneurship and high-value industries1.
The sub-pillars are High-level Skills and Talent Impact1. High-level Skills includes professionals, researchers, senior officials and managers and digital skills, plus the new indicators on soft skills and AI talent concentration1. Talent Impact includes ICT services exports, high-value exports, new business density and scientific journal articles1.
Soft skills and workforce adaptability
The rename recognizes the growing importance of soft cooperative skills, adaptability and interdisciplinary problem-solving1. High-income economies dominate the global top ten in soft skills, led by Denmark, Iceland, Switzerland, the Netherlands and Finland, and the Philippines is the only lower middle-income economy in that top ten4. The GTCI site frames adaptability as the new driver of competitiveness, which the GA Skills dimension operationalizes4.
Singapore ranks first on GA Skills in 2025, Israel second and Ireland third1. The United States fell on this pillar to 13th from 5th, a shift that reflects the introduction of new metrics alongside lower outcomes1.
Pillar leaders in GTCI 2025
| Pillar | 1st | 2nd | 3rd |
|---|---|---|---|
| Enable | Denmark | Finland | Switzerland1 |
| Attract | Luxembourg | Singapore | United Arab Emirates1 |
| Grow | Netherlands | United States | United Kingdom1 |
| Retain | Norway | Sweden | Denmark1 |
| VT Skills | Czech Republic | United States | Switzerland1 |
| GA Skills | Singapore | Israel | Ireland1 |
Read across the table and a pattern shows. No single country leads more than one pillar1. Denmark, Switzerland, the United States and Singapore each appear twice, and the pillar leaders are not the overall top three: the Netherlands leads in growing talent and Luxembourg in attracting it1. Denmark, Finland and Switzerland rank near the top in enabling and retaining talent1. Switzerland is the model of balance: every pillar sits in the top ten, and Enable and VT Skills, both 3rd, are its best1. For the full 2025 ranking, see the GTCI 2025 results.
What changed in the pillars between editions
The pillar structure has held since the start; the labels and indicators have moved. The 2017 report grouped 65 variables into 14 sub-pillars2, the 2023 report 69 indicators into 14 sub-pillars3, and the 2025 model 77 indicators into 14 sub-pillars1. The sub-pillar count stayed at 14 while the indicator count grew.
The 2025 edition introduced indicators such as AI-related and soft skills, workforce resilience and employee well-being1. Its adjustments table lists as new additions the household financial resilience, protection against future disasters and employee wellbeing indicators in Retain, and soft skills and mobile apps development in GA Skills1. Because indicators changed, a pillar rank in 2025 is not a clean continuation of the same pillar in 2023, and the GTCI methodology page explains why comparisons across editions need caution.
Who builds the pillars: INSEAD, Portulans and the JRC audit
INSEAD Business School launched the GTCI in 20131. The 2025 edition marks the beginning of a partnership between INSEAD and the Portulans Institute1. Felipe Monteiro is the academic director, and Paul Evans, who co-founded the index, was its former academic director1.
The European Commission’s Joint Research Centre audits every edition independently, testing the statistical structure of the pillars described above1. For how the audit tests the pillars, read how the index is calculated. For the plain-English overview, start with what the GTCI is.
Reading a pillar rank without misreading it
Three cautions apply to every pillar number in this guide.
- A pillar rank belongs to its edition. Rankings are not directly comparable between one year and another, because the framework, data and sample change1.
- A pillar rank is not the overall rank. Between 33% and 60% of countries rank differently on the GTCI than on each of the six pillars1.
- A top pillar can sit beside a weak one. Denmark leads Enable but ranks 10th on both Attract and Grow, and Singapore leads GA Skills but ranks 31st on Retain1.
Pillar leaders are also a reading of the model, not a verdict on a country’s workforce. The rest of the index is explained in the method section, and the 2025 report has every pillar table.
Read next
How the index works
What is the Global Talent Competitiveness Index (GTCI)?
What the GTCI talent ranking measures, how its six pillars and 0 to 100 scores are built, who publishes it and how it differs from other rankings.
Rankings by edition
GTCI 2025 ranking: top 25 countries and scores
The Global Talent Competitiveness Index 2025 top 25 with scores, pillar leaders and what moved against the 2023 edition, from the INSEAD and Portulans report.
How the index works
GTCI methodology: how the score is calculated
How the GTCI turns 77 indicators into one score: sources, coverage rules, outliers, 0 to 100 scaling, equal weights and the JRC audit, with worked examples.
Sources
- Global Talent Competitiveness Index 2025: Talent and resilience · INSEAD and Portulans Institute, GTCI 2025 · portulansinstitute.org · checked October 21, 2026
- The Global Talent Competitiveness Index 2017: Talent and technology · INSEAD, Adecco Group and HCLI, GTCI 2017 · globaltalentcompetitivenessindex.org · checked October 21, 2026
- The Global Talent Competitiveness Index 2023: What a difference ten years make · INSEAD, Descartes Institute for the Future and partners, GTCI 2023 (copy hosted by InvestChile) · investchile.gob.cl · checked October 21, 2026
- Global Talent Competitiveness Index: GTCI 2025 key messages · GTCI website (INSEAD and Portulans Institute) · globaltalentcompetitivenessindex.org · checked October 21, 2026
Image credits (1)
- GTCI Insights, own chart · Own work from the published indicator list · source
Published . Rankings change with every edition: each figure names its edition year and each source shows the day it was checked. How we check facts · Report an error.