On this page
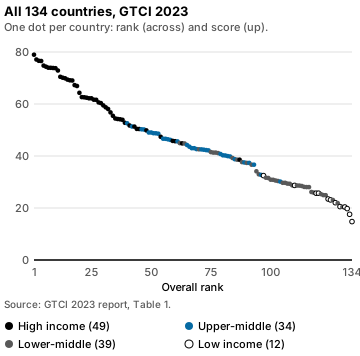
The 2023 edition is the tenth, and it reads like a quiet one1. The top three were the usual three, the movement below them was small, and a Japan that had been in the top 25 every year dropped to 26th1. Behind the calm sits a ranking that rewards a particular profile: rich, European or Pacific-rim, strong across all six pillars. This page gives the full table of 134 countries first, then the top ten in detail, the pillar leaders, the change since 2022, and the cautions that apply when you set 2023 beside any other edition.
The 2023 ranking: top 25 of 134
Table 1 of the GTCI 2023 report lists every country with its score, income group and region1. The first 25 rows are reproduced here as printed, and all 25 are in the high-income group1. The ranking covers 134 countries, up from 133 in 2022, with Uzbekistan the only newcomer1.
| Rank | Country | Score | Region |
|---|---|---|---|
| 1 | Switzerland | 78.96 | Europe1 |
| 2 | Singapore | 77.11 | Eastern, Southeastern Asia and Oceania1 |
| 3 | United States of America | 76.60 | Northern America1 |
| 4 | Denmark | 76.54 | Europe1 |
| 5 | Netherlands | 74.76 | Europe1 |
| 6 | Finland | 74.35 | Europe1 |
| 7 | Norway | 73.96 | Europe1 |
| 8 | Australia | 73.93 | Eastern, Southeastern Asia and Oceania1 |
| 9 | Sweden | 73.86 | Europe1 |
| 10 | United Kingdom | 73.75 | Europe1 |
| 11 | Luxembourg | 72.88 | Europe1 |
| 12 | Ireland | 70.45 | Europe1 |
| 13 | Canada | 70.13 | Northern America1 |
| 14 | Germany | 69.88 | Europe1 |
| 15 | Iceland | 69.38 | Europe1 |
| 16 | Belgium | 69.12 | Europe1 |
| 17 | Austria | 69.05 | Europe1 |
| 18 | New Zealand | 67.26 | Eastern, Southeastern Asia and Oceania1 |
| 19 | France | 66.91 | Europe1 |
| 20 | Estonia | 64.29 | Europe1 |
| 21 | Malta | 62.66 | Europe1 |
| 22 | United Arab Emirates | 62.56 | Northern Africa and Western Asia1 |
| 23 | Czech Republic | 62.43 | Europe1 |
| 24 | Korea, Rep. | 62.21 | Eastern, Southeastern Asia and Oceania1 |
| 25 | Israel | 62.20 | Northern Africa and Western Asia1 |
European countries took 17 of the top 25 places1. The other eight are Singapore and the United States at the top, and Australia, Canada, New Zealand, the United Arab Emirates, South Korea and Israel1. The notable change in the group is the exit of Japan, which gave way to South Korea, the first time for either1. The gap steepens below the top ten: the tenth-ranked United Kingdom scores 73.75 and the 25th-ranked Israel 62.201.
The top ten in the GTCI 2023 ranking
Switzerland (1st, 78.96) was first in every edition to date1. It is in the top ten on all six pillars, global leader in Enable and Retain, 2nd in Vocational and Technical Skills and 3rd in Attract1. Its best sub-pillar is Sustainability, 1st, which the report links to high social protection and the quality of its natural environment1. Its weakest, 15th each, are Access to Growth Opportunities and High-Level Skills1.
Singapore (2nd, 77.11) held second place in every edition except 20201. It leads the world in Global Knowledge Skills, where a highly educated workforce and an innovative economy put it first in High-Level Skills and Talent Impact1. It is 2nd in Attract and 3rd in both Grow and Vocational and Technical Skills, and 2nd in Employability1. Its weak point is retaining talent, 36th1.
United States (3rd, 76.60) climbed one place and returned to the top three, which it has made five times in ten years1. It leads two pillars, Grow and Vocational and Technical Skills, with 1st in Lifelong Learning and 2nd in Formal Education1. Attract, 22nd, is its weakest pillar1.
Denmark (4th, 76.54) fell from 3rd in 20222 with a score only slightly below the United States’ 76.601. It ranks 2nd on both Enable and Retain1. It had reached the top three just once before 20221.
Netherlands (5th, 74.76) achieved its highest rank and entered the top five for the first time1. Its strongest pillar is Grow, 4th1. Finland (6th, 74.35) climbed two places, matching its best ever rank, also reached in 2018 and 20191. Norway (7th, 73.96) held its place, with Retain, 3rd, its best pillar, partly driven by wide access to social protection and benefits1.
Australia (8th, 73.93) climbed one place, its fifth top-ten finish since the index began1. Global Knowledge Skills, 3rd, is its best pillar and Vocational and Technical Skills, 19th, its worst1. Sweden (9th, 73.86) fell from 5th in 2022 to its lowest position in the index, though it stayed in the top ten and ranks 7th in Retain1,2. The United Kingdom (10th, 73.75) kept its place; it has been in the top 15 every year and in the top ten eight times, and ranks 2nd in Grow but 29th in Vocational and Technical Skills1.
A pattern worth taking from these ten: none is strong everywhere. Even Switzerland has two sub-pillars at 15th, and the United States ranks 22nd on attracting talent1. A top-ten place is a high floor, not perfection. The rankings hub links the other editions.
Pillar leaders in GTCI 2023
The overall score averages four Input pillars and two Output pillars1. Each pillar has its own leaders, and they overlap heavily with the overall top ten1.
| Pillar | 1st | 2nd | 3rd |
|---|---|---|---|
| Enable | Switzerland | Denmark | Finland1 |
| Attract | Luxembourg | Singapore | Switzerland1 |
| Grow | United States | United Kingdom | Singapore1 |
| Retain | Switzerland | Denmark | Norway1 |
| Vocational and Technical (VT) Skills | United States | Switzerland | Singapore1 |
| Global Knowledge (GK) Skills | Singapore | United Kingdom | Australia1 |
Every country in these three-deep lists also ranks in the top 15 overall1. Luxembourg (11th overall) is the one pillar leader outside the top ten, first on Attract1. Lower down, the United Arab Emirates (22nd overall) has one of the best scores on Attract1. Japan (26th overall), France (19th) and Malta (21st) are among the top ten on Enable, Grow and Retain respectively, and the Czech Republic (23rd) shines in Vocational and Technical Skills and South Korea (24th) in Global Knowledge Skills1.
Two patterns come with the table. The ability to retain talent varies much more between countries than the ability to attract it1. And Global Knowledge Skills vary more than Vocational and Technical Skills, which points to high-level skills as what separates countries most1. The Output pillar called Global Knowledge Skills here was relabelled Generalist Adaptive Skills in the 2025 edition, so a 2023 pillar rank and a 2025 pillar rank under similar names are not guaranteed to be like for like3. The pillar guide explains what each pillar holds.
What changed since the 2022 edition
The 2023 ranking was steadier than 2022. Just two countries shifted by ten or more places in 2023, where the 2022 count was 181. The report puts that down to COVID fading and to unchanged indicators, after a stretch of bigger swings1.
Worked example (our arithmetic). The table subtracts each country’s 2023 rank from its 2022 rank, both read from the published tables of the 2023 report and the 2022 report1,2. A positive number is a climb.
| Country | 2023 rank | 2022 rank | Change |
|---|---|---|---|
| Switzerland | 1 | 1 | no change1,2 |
| Singapore | 2 | 2 | no change1,2 |
| United States of America | 3 | 4 | up 11,2 |
| Denmark | 4 | 3 | down 11,2 |
| Netherlands | 5 | 6 | up 11,2 |
| Finland | 6 | 8 | up 21,2 |
| Norway | 7 | 7 | no change1,2 |
| Australia | 8 | 9 | up 11,2 |
| Sweden | 9 | 5 | down 41,2 |
| United Kingdom | 10 | 10 | no change1,2 |
| Luxembourg | 11 | 11 | no change1,2 |
| Ireland | 12 | 13 | up 11,2 |
| Canada | 13 | 15 | up 21,2 |
| Germany | 14 | 14 | no change1,2 |
| Iceland | 15 | 12 | down 31,2 |
| Belgium | 16 | 16 | no change1,2 |
| Austria | 17 | 17 | no change1,2 |
| New Zealand | 18 | 18 | no change1,2 |
| France | 19 | 19 | no change1,2 |
| Estonia | 20 | 20 | no change1,2 |
| Malta | 21 | 22 | up 11,2 |
| United Arab Emirates | 22 | 25 | up 31,2 |
| Czech Republic | 23 | 21 | down 21,2 |
| Korea, Rep. | 24 | 27 | up 31,2 |
| Israel | 25 | 23 | down 21,2 |
Of these 25 countries, 9 rose, 5 fell and 11 kept the same rank1,2. The biggest fall in the group was Sweden, 5th to 9th, and the biggest climbs were three places each for the United Arab Emirates and South Korea1,2. Reading the full tables side by side, the two countries that moved ten places or more were Jamaica, up 10, and Panama, down 231,2. The report does not name them; the arithmetic is ours.
Regions and income groups
Income decides most of this ranking. Of the 134 countries, 49 are high income, 34 upper-middle, 39 lower-middle and 12 low income1. The 25th percentile of the high-income group, the country a quarter of the way up from the bottom of that group, outscores the best upper-middle-income country, China1.
Worked example (our arithmetic). The best-ranked country in each income group and region, read from the rows of Table 11.
| Group | Countries | Best-ranked country | Overall rank |
|---|---|---|---|
| High income | 491 | Switzerland | 11 |
| Upper-middle income | 341 | China | 401 |
| Lower-middle income | 391 | Uzbekistan | 621 |
| Low income | 121 | Gambia | 971 |
| Europe | 391 | Switzerland | 11 |
| Eastern, Southeastern Asia and Oceania | 151 | Singapore | 21 |
| Northern America | 21 | United States of America | 31 |
| Northern Africa and Western Asia | 181 | United Arab Emirates | 221 |
| Latin America and the Caribbean | 191 | Chile | 341 |
| Sub-Saharan Africa | 321 | Mauritius | 511 |
| Central and Southern Asia | 91 | Uzbekistan | 621 |
Northern America and Europe, the regions with the largest shares of high-income countries, are the two best performers, and Sub-Saharan Africa and Central and Southern Asia the two weakest1. Uzbekistan, new in 2023, entered as the top lower-middle-income country1. Gambia, 97th, has been in the third quartile in the five most recent editions, and Uganda is third-highest in the low-income group1.
The BRICS countries in 2023
China, 40th, remains the leading member of the group of Brazil, Russia, India, China and South Africa1. It is the world leader on Employability, which measures how well people’s skills match the economy, but 91st on Attract1. Russia is 52nd, around 50th in most editions, with a caution that some of the data predate the invasion of Ukraine1. South Africa is 68th, held back by Vocational and Technical Skills, and Brazil 69th, in the upper half on Grow and Enable1. India is the lowest of the five at 103rd1. It rose until 2020 and has fallen in each of the three years since, which the report links to a slump in business sentiment that pulled Attract down to 132nd of 134, while Global Knowledge Skills remain its best area1.
Full ranking: 26th to 134th
The rest of Table 1, as printed, from Japan in 26th to Chad in 134th1.
Show every other country, from Japan to Chad
| Rank | Country | Score | Income group | Region |
|---|---|---|---|---|
| 26 | Japan | 61.65 | High income | Eastern, Southeastern Asia and Oceania1 |
| 27 | Portugal | 61.60 | High income | Europe1 |
| 28 | Slovenia | 60.62 | High income | Europe1 |
| 29 | Spain | 60.36 | High income | Europe1 |
| 30 | Cyprus | 59.46 | High income | Northern Africa and Western Asia1 |
| 31 | Lithuania | 58.73 | High income | Europe1 |
| 32 | Italy | 58.07 | High income | Europe1 |
| 33 | Latvia | 56.78 | High income | Europe1 |
| 34 | Chile | 55.48 | High income | Latin America and the Caribbean1 |
| 35 | Qatar | 54.42 | High income | Northern Africa and Western Asia1 |
| 36 | Slovakia | 54.24 | High income | Europe1 |
| 37 | Poland | 54.10 | High income | Europe1 |
| 38 | Hungary | 53.91 | High income | Europe1 |
| 39 | Greece | 52.75 | High income | Europe1 |
| 40 | China | 52.57 | Upper-middle income | Eastern, Southeastern Asia and Oceania1 |
| 41 | Brunei Darussalam | 51.74 | High income | Eastern, Southeastern Asia and Oceania1 |
| 42 | Malaysia | 51.35 | Upper-middle income | Eastern, Southeastern Asia and Oceania1 |
| 43 | Uruguay | 51.29 | High income | Latin America and the Caribbean1 |
| 44 | Bahrain | 50.44 | High income | Northern Africa and Western Asia1 |
| 45 | Croatia | 50.38 | High income | Europe1 |
| 46 | Georgia | 50.25 | Upper-middle income | Northern Africa and Western Asia1 |
| 47 | Costa Rica | 50.20 | Upper-middle income | Latin America and the Caribbean1 |
| 48 | Saudi Arabia | 49.86 | High income | Northern Africa and Western Asia1 |
| 49 | Bulgaria | 49.05 | Upper-middle income | Europe1 |
| 50 | Montenegro | 49.05 | Upper-middle income | Europe1 |
| 51 | Mauritius | 48.77 | Upper-middle income | Sub-Saharan Africa1 |
| 52 | Russian Federation | 48.72 | Upper-middle income | Europe1 |
| 53 | Serbia | 48.56 | Upper-middle income | Europe1 |
| 54 | Romania | 47.39 | High income | Europe1 |
| 55 | Armenia | 46.67 | Upper-middle income | Northern Africa and Western Asia1 |
| 56 | Albania | 46.61 | Upper-middle income | Europe1 |
| 57 | Belarus | 46.41 | Upper-middle income | Europe1 |
| 58 | Azerbaijan | 46.19 | Upper-middle income | Northern Africa and Western Asia1 |
| 59 | Oman | 45.82 | High income | Northern Africa and Western Asia1 |
| 60 | Trinidad and Tobago | 45.68 | High income | Latin America and the Caribbean1 |
| 61 | Argentina | 45.60 | Upper-middle income | Latin America and the Caribbean1 |
| 62 | Uzbekistan | 44.97 | Lower-middle income | Central and Southern Asia1 |
| 63 | Kuwait | 44.83 | High income | Northern Africa and Western Asia1 |
| 64 | Ukraine | 44.80 | Lower-middle income | Europe1 |
| 65 | Moldova, Rep. | 44.22 | Upper-middle income | Europe1 |
| 66 | Jamaica | 43.59 | Upper-middle income | Latin America and the Caribbean1 |
| 67 | Kazakhstan | 43.01 | Upper-middle income | Central and Southern Asia1 |
| 68 | South Africa | 43.01 | Upper-middle income | Sub-Saharan Africa1 |
| 69 | Brazil | 42.67 | Upper-middle income | Latin America and the Caribbean1 |
| 70 | Jordan | 42.56 | Lower-middle income | Northern Africa and Western Asia1 |
| 71 | North Macedonia | 42.53 | Upper-middle income | Europe1 |
| 72 | Colombia | 42.44 | Upper-middle income | Latin America and the Caribbean1 |
| 73 | Botswana | 42.28 | Upper-middle income | Sub-Saharan Africa1 |
| 74 | Mexico | 42.17 | Upper-middle income | Latin America and the Caribbean1 |
| 75 | Viet Nam | 41.50 | Lower-middle income | Eastern, Southeastern Asia and Oceania1 |
| 76 | Mongolia | 41.31 | Lower-middle income | Eastern, Southeastern Asia and Oceania1 |
| 77 | Lebanon | 41.30 | Lower-middle income | Northern Africa and Western Asia1 |
| 78 | Cabo Verde | 41.11 | Lower-middle income | Sub-Saharan Africa1 |
| 79 | Thailand | 40.77 | Upper-middle income | Eastern, Southeastern Asia and Oceania1 |
| 80 | Indonesia | 40.25 | Upper-middle income | Eastern, Southeastern Asia and Oceania1 |
| 81 | Türkiye | 40.20 | Upper-middle income | Northern Africa and Western Asia1 |
| 82 | Peru | 39.96 | Upper-middle income | Latin America and the Caribbean1 |
| 83 | Bosnia and Herzegovina | 39.79 | Upper-middle income | Europe1 |
| 84 | Philippines | 39.23 | Lower-middle income | Eastern, Southeastern Asia and Oceania1 |
| 85 | Ecuador | 38.77 | Upper-middle income | Latin America and the Caribbean1 |
| 86 | Kyrgyzstan | 38.58 | Lower-middle income | Central and Southern Asia1 |
| 87 | Panama | 38.56 | High income | Latin America and the Caribbean1 |
| 88 | Egypt | 37.67 | Lower-middle income | Northern Africa and Western Asia1 |
| 89 | Dominican Republic | 37.51 | Upper-middle income | Latin America and the Caribbean1 |
| 90 | Sri Lanka | 37.36 | Lower-middle income | Central and Southern Asia1 |
| 91 | Paraguay | 37.36 | Upper-middle income | Latin America and the Caribbean1 |
| 92 | Tunisia | 36.67 | Lower-middle income | Northern Africa and Western Asia1 |
| 93 | Namibia | 36.67 | Upper-middle income | Sub-Saharan Africa1 |
| 94 | Bolivia, Plurinational St. | 34.11 | Lower-middle income | Latin America and the Caribbean1 |
| 95 | Ghana | 32.97 | Lower-middle income | Sub-Saharan Africa1 |
| 96 | El Salvador | 32.74 | Upper-middle income | Latin America and the Caribbean1 |
| 97 | Gambia | 32.48 | Low income | Sub-Saharan Africa1 |
| 98 | Kenya | 31.66 | Lower-middle income | Sub-Saharan Africa1 |
| 99 | Morocco | 31.53 | Lower-middle income | Northern Africa and Western Asia1 |
| 100 | Eswatini | 30.87 | Lower-middle income | Sub-Saharan Africa1 |
| 101 | Lao PDR | 30.83 | Lower-middle income | Eastern, Southeastern Asia and Oceania1 |
| 102 | Algeria | 30.56 | Lower-middle income | Northern Africa and Western Asia1 |
| 103 | India | 30.37 | Lower-middle income | Central and Southern Asia1 |
| 104 | Guatemala | 30.16 | Upper-middle income | Latin America and the Caribbean1 |
| 105 | Honduras | 29.71 | Lower-middle income | Latin America and the Caribbean1 |
| 106 | Cambodia | 29.69 | Lower-middle income | Eastern, Southeastern Asia and Oceania1 |
| 107 | Nepal | 29.37 | Lower-middle income | Central and Southern Asia1 |
| 108 | Zambia | 29.32 | Lower-middle income | Sub-Saharan Africa1 |
| 109 | Pakistan | 28.72 | Lower-middle income | Central and Southern Asia1 |
| 110 | Rwanda | 28.71 | Low income | Sub-Saharan Africa1 |
| 111 | Côte d’Ivoire | 28.67 | Lower-middle income | Sub-Saharan Africa1 |
| 112 | Senegal | 28.62 | Lower-middle income | Sub-Saharan Africa1 |
| 113 | Benin | 28.45 | Lower-middle income | Sub-Saharan Africa1 |
| 114 | Nigeria | 28.12 | Lower-middle income | Sub-Saharan Africa1 |
| 115 | Nicaragua | 28.05 | Lower-middle income | Latin America and the Caribbean1 |
| 116 | Iran, Islamic Rep. | 28.03 | Lower-middle income | Central and Southern Asia1 |
| 117 | Zimbabwe | 26.16 | Lower-middle income | Sub-Saharan Africa1 |
| 118 | Cameroon | 25.91 | Lower-middle income | Sub-Saharan Africa1 |
| 119 | Uganda | 25.71 | Low income | Sub-Saharan Africa1 |
| 120 | Malawi | 25.68 | Low income | Sub-Saharan Africa1 |
| 121 | Tanzania, United Rep. | 25.33 | Lower-middle income | Sub-Saharan Africa1 |
| 122 | Lesotho | 24.96 | Lower-middle income | Sub-Saharan Africa1 |
| 123 | Bangladesh | 24.91 | Lower-middle income | Central and Southern Asia1 |
| 124 | Burundi | 23.46 | Low income | Sub-Saharan Africa1 |
| 125 | Madagascar | 23.10 | Low income | Sub-Saharan Africa1 |
| 126 | Mauritania | 23.09 | Lower-middle income | Sub-Saharan Africa1 |
| 127 | Mali | 22.02 | Low income | Sub-Saharan Africa1 |
| 128 | Guinea | 21.87 | Lower-middle income | Sub-Saharan Africa1 |
| 129 | Burkina Faso | 20.55 | Low income | Sub-Saharan Africa1 |
| 130 | Angola | 20.43 | Lower-middle income | Sub-Saharan Africa1 |
| 131 | Mozambique | 20.40 | Low income | Sub-Saharan Africa1 |
| 132 | Ethiopia | 19.77 | Low income | Sub-Saharan Africa1 |
| 133 | Congo, Dem. Rep. | 17.57 | Low income | Sub-Saharan Africa1 |
| 134 | Chad | 14.78 | Low income | Sub-Saharan Africa1 |
How the 2023 ranking was built
The 2023 model has 69 indicators, the same number as 2022, though one indicator was removed and one added1. The new one is vulnerable employment, a labour-focused addition to the Sustainability sub-pillar1. The data set has 93.8% data coverage, and data for 56 indicators refer to 2022 or 2021, with only three indicators using data from 2018 or earlier1. A country needs at least 80% data availability at the index level and 60% at the sub-pillar level to be included1.
Input and Output are averaged separately, then combined. Enable, Attract, Grow and Retain are the four Input pillars; Vocational and Technical Skills and Global Knowledge Skills are the two Output pillars1. Retention rests on sustainability and quality of life, and the report finds a strong positive correlation between a country’s quality of life and its talent performance1. The methodology guide shows how those pieces become a single score, using the 2025 edition3.
Reading the 2023 ranking next to other editions
Three cautions keep a comparison honest. First, scores belong to their edition: a score that changes between editions might primarily reflect a methodological adjustment rather than new data1. Switzerland’s 78.96 in 2023 sits beside 78.20 in 2022 and cannot be read as a climb on the same ruler1,2. Second, the link between income and rank is tightening: the correlation between GDP per capita and GTCI score grew from 0.76 in 2013 to 0.85 in 2023, so a strong rank partly restates national wealth1. Third, the 2025 edition moved to a 77-indicator model against 69 here, so a rank change between 2023 and 2025 mixes performance with design3.
The sturdier habit is to quote the edition and the rank together, as in “the United States ranked 3rd in the 2023 edition”1, and to compare ranks across editions only with that warning. For the long view, every edition from 2013 to 2023 sits in one table, who led each edition follows the margins, and the 2025 results page has the newer table, with the pause in 2024 explained there3.
RelatedGTCI editions 2013 to 2023: themes, coverage, top threeGTCI 2025 ranking: top 25 countries and scoresWho led the GTCI, 2013 to 2025: Switzerland, then Singapore
Sources
- The Global Talent Competitiveness Index 2023: What a difference ten years make · INSEAD, Descartes Institute for the Future and partners, GTCI 2023 (copy hosted by InvestChile) · investchile.gob.cl · checked October 21, 2026
- The Global Talent Competitiveness Index 2022: The tectonics of talent · INSEAD, Portulans Institute and partners, GTCI 2022 · globaltalentcompetitivenessindex.org · checked October 21, 2026
- Global Talent Competitiveness Index 2025: Talent and resilience · INSEAD and Portulans Institute, GTCI 2025 · portulansinstitute.org · checked October 21, 2026
Image credits (1)
- GTCI Insights, own chart · Own work from the published ranking table · source
Published . Rankings change with every edition: each figure names its edition year and each source shows the day it was checked. How we check facts · Report an error.