On this page
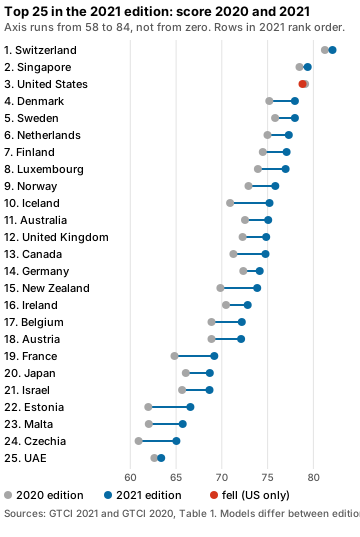
The 2021 edition is the eighth, and it is the one built around a pandemic1. It came out in the fall, not at the usual Davos date, with a virtual launch in place of a physical one1. The ranking itself was calm at the top: the same 25 countries as the year before, with one small shuffle inside the top 151. What changed was the world they were measured in. This page gives the table first, then the top ten country by country, the pillar leaders, the move since the 2020 edition, the regional and income picture, and the cautions that apply when you set 2021 beside any other year.
The 2021 ranking: top 40 of 134
Table 1 of the GTCI 2021 report lists every country with its score, income group and region1. The first 40 rows are reproduced here as printed1. The index covers 134 countries, up from 132 in 2020 and representing almost 98% of world GDP and more than 94% of its population1.
| Rank | Country | Score | Region | Income group |
|---|---|---|---|---|
| 1 | Switzerland | 82.09 | Europe | High1 |
| 2 | Singapore | 79.38 | East and Southeast Asia, Oceania | High1 |
| 3 | United States of America | 78.81 | Northern America | High1 |
| 4 | Denmark | 77.98 | Europe | High1 |
| 5 | Sweden | 77.98 | Europe | High1 |
| 6 | Netherlands | 77.31 | Europe | High1 |
| 7 | Finland | 77.07 | Europe | High1 |
| 8 | Luxembourg | 76.96 | Europe | High1 |
| 9 | Norway | 75.84 | Europe | High1 |
| 10 | Iceland | 75.21 | Europe | High1 |
| 11 | Australia | 75.06 | East and Southeast Asia, Oceania | High1 |
| 12 | United Kingdom | 74.84 | Europe | High1 |
| 13 | Canada | 74.77 | Northern America | High1 |
| 14 | Germany | 74.13 | Europe | High1 |
| 15 | New Zealand | 73.86 | East and Southeast Asia, Oceania | High1 |
| 16 | Ireland | 72.82 | Europe | High1 |
| 17 | Belgium | 72.18 | Europe | High1 |
| 18 | Austria | 72.10 | Europe | High1 |
| 19 | France | 69.18 | Europe | High1 |
| 20 | Japan | 68.68 | East and Southeast Asia, Oceania | High1 |
| 21 | Israel | 68.65 | Northern Africa and Western Asia | High1 |
| 22 | Estonia | 66.57 | Europe | High1 |
| 23 | Malta | 65.72 | Europe | High1 |
| 24 | Czech Republic | 65.03 | Europe | High1 |
| 25 | United Arab Emirates | 63.38 | Northern Africa and Western Asia | High1 |
| 26 | Slovenia | 63.16 | Europe | High1 |
| 27 | Korea, Rep. | 63.16 | East and Southeast Asia, Oceania | High1 |
| 28 | Portugal | 62.95 | Europe | High1 |
| 29 | Spain | 61.85 | Europe | High1 |
| 30 | Cyprus | 61.63 | Northern Africa and Western Asia | High1 |
| 31 | Latvia | 60.68 | Europe | High1 |
| 32 | Lithuania | 60.25 | Europe | High1 |
| 33 | Chile | 60.00 | Latin America and the Caribbean | High1 |
| 34 | Malaysia | 59.70 | East and Southeast Asia, Oceania | Upper-middle1 |
| 35 | Italy | 58.79 | Europe | High1 |
| 36 | Qatar | 58.73 | Northern Africa and Western Asia | High1 |
| 37 | China | 57.17 | East and Southeast Asia, Oceania | Upper-middle1 |
| 38 | Slovakia | 56.70 | Europe | High1 |
| 39 | Costa Rica | 55.75 | Latin America and the Caribbean | Upper-middle1 |
| 40 | Poland | 55.69 | Europe | High1 |
European countries took 17 of the top 25 places1. The eight others are Singapore and the United States at the top, then Australia, Canada, New Zealand, Japan, Israel and the United Arab Emirates1. France entered the top 20 at 19th1. Past the top 25 the table opens up: Chile is 33rd, Malaysia 34th, China 37th and Costa Rica 39th1. Denmark and Sweden print the same score, 77.98, at fourth and fifth1.
Worked example (our arithmetic). The score gaps between rank 1, 10, 25 and 40 show where the ranking is steep. Each line subtracts two scores from the table above1.
| Stretch | Calculation | Gap |
|---|---|---|
| Rank 1 to rank 10 | 82.09 − 75.21 | 6.88 points1 |
| Rank 10 to rank 25 | 75.21 − 63.38 | 11.83 points1 |
| Rank 25 to rank 40 | 63.38 − 55.69 | 7.69 points1 |
| Rank 1 to rank 25 | 82.09 − 63.38 | 18.71 points1 |
The steepest stretch is the middle, between tenth and twenty-fifth place. That is where a country’s rank is most sensitive to a small change in score, and where yearly reshuffles are largest.
The top ten in the GTCI 2021 ranking
Switzerland (1st, 82.09) is the highest-ranked country in three of the six pillars, Enable, Retain, and Vocational and Technical Skills, and is in the top 5 in the other three: Grow (3rd), Attract (4th) and Global Knowledge Skills (5th)1. It reaches the top 10 in 12 of 14 sub-pillars and leads the world in three: Market Landscape, Business and Labour Landscape, and Sustainability1. Gender equality is the area where it could improve most, including by helping more women into high-skilled jobs1.
Singapore (2nd, 79.38) is in the top 3 in four of the six pillars: Enable (2nd), Attract (2nd), Grow (2nd) and Global Knowledge Skills (3rd)1. Its weakness is retaining talent, 35th1. It is first in Employability, which measures how well skills match the labor market, but its Mid-Level Skills rank only 25th1.
United States (3rd, 78.81) is the global leader in growing talent, thanks to first place in Lifelong Learning and second in Formal Education1. Retaining talent is its weakest pillar at 20th, and Lifestyle, 43rd, is the priority within it1.
Denmark (4th, 77.98) is in the top 3 for both Enable and Retain, 3rd in each1. Its strongest sub-pillar is Talent Impact, 1st1. Sweden (5th, 77.98) does not feature in the top 3 of any pillar, yet it is the only country in the 2021 edition ranked better than 50 on every single indicator1. Its best pillar is Enable, 4th, and it is 5th in both Grow and Retain1. Its weak spot is Employability, 20th, which reflects concern about skill gaps1.
Netherlands (6th, 77.31) is in the top 10 on three pillars: Grow (4th), Enable (5th) and Retain (8th)1. Finland (7th, 77.07) is 2nd in Vocational and Technical Skills, and its weakest pillar is Global Knowledge Skills, 16th1. Luxembourg (8th, 76.96) claims the top spot for attracting talent, on the strength of a world-beating External Openness, while its Vocational and Technical Skills, 21st, are its main weakness1.
Norway (9th, 75.84) is second in the world for retaining talent, and attracting talent, 18th, is its main weakness1. Iceland (10th, 75.21) has the world’s foremost pool of Global Knowledge Skills, while Attract (16th) and Grow (18th) are its lowest-ranked pillars1.
No top-ten country is strong everywhere. The pattern across the ten is a high floor, not a perfect profile. For more on how each pillar is built, see the pillar guide; the rankings hub links the other editions.
Pillar leaders in GTCI 2021
The overall score is the simple average of six pillar scores1. All the countries ranked in the top 3 of any pillar are in the overall top 151. The top 15 occupy the five highest ranks in each of the six pillars1.
| Pillar | 1st | 2nd | 3rd |
|---|---|---|---|
| Enable | Switzerland | Singapore | Denmark1 |
| Attract | Luxembourg | Singapore | New Zealand1 |
| Grow | United States | Singapore | Switzerland1 |
| Retain | Switzerland | Norway | Denmark1 |
| Vocational and Technical (VT) Skills | Switzerland | Finland | United States1 |
| Global Knowledge (GK) Skills | Iceland | United States | Singapore1 |
Switzerland and Singapore are in the top 3 on four of the six pillars each1. A few countries below the top 15 do well on single pillars. Ireland, 16th, and Austria, 18th, each make the top 10 in two pillars, Attract and Global Knowledge Skills for Ireland, Retain and Vocational and Technical Skills for Austria1. The United Arab Emirates, 25th, and Qatar, 36th, are in the top 10 for attracting talent1.
The Output pillar labeled Global Knowledge Skills here was relabeled Generalist Adaptive Skills in the 2025 edition, so a pillar rank under that name in a recent edition is not guaranteed to be like for like4. See the GTCI 2023 ranking and the 2025 results for how the pillars read after the model changed.
What changed since the 2020 edition
The top 25 of 2021 holds the same countries as in the 2020 edition, and the top 15 differs by only one place: New Zealand swapped with Ireland, so New Zealand is 15th and Ireland 16th1. Singapore overtook the United States for second place2,1. The table below sets each country’s rank in three consecutive editions side by side.
Worked example (our arithmetic). Each change subtracts the 2021 rank from the 2020 rank, both read from Table 1 of the GTCI 2020 report and of the 2021 report2,1. A positive change is a climb. The 2022 column, from the GTCI 2022 report, is shown for context only3.
| Country | 2020 rank | 2021 rank | 2022 rank | Change 2020 to 2021 |
|---|---|---|---|---|
| Switzerland | 1 | 1 | 1 | no change2,1,3 |
| Singapore | 3 | 2 | 2 | up 12,1,3 |
| United States of America | 2 | 3 | 4 | down 12,1,3 |
| Denmark | 5 | 4 | 3 | up 12,1,3 |
| Sweden | 4 | 5 | 5 | down 12,1,3 |
| Netherlands | 6 | 6 | 6 | no change2,1,3 |
| Finland | 7 | 7 | 8 | no change2,1,3 |
| Luxembourg | 8 | 8 | 11 | no change2,1,3 |
| Norway | 9 | 9 | 7 | no change2,1,3 |
| Iceland | 14 | 10 | 12 | up 42,1,3 |
| Australia | 10 | 11 | 9 | down 12,1,3 |
| United Kingdom | 12 | 12 | 10 | no change2,1,3 |
| Canada | 13 | 13 | 15 | no change2,1,3 |
| Germany | 11 | 14 | 14 | down 32,1,3 |
| New Zealand | 16 | 15 | 18 | up 12,1,3 |
| Ireland | 15 | 16 | 13 | down 12,1,3 |
| Belgium | 18 | 17 | 16 | up 12,1,3 |
| Austria | 17 | 18 | 17 | down 12,1,3 |
| France | 21 | 19 | 19 | up 22,1,3 |
| Japan | 19 | 20 | 24 | down 12,1,3 |
| Israel | 20 | 21 | 23 | down 12,1,3 |
| Estonia | 24 | 22 | 20 | up 22,1,3 |
| Malta | 23 | 23 | 22 | no change2,1,3 |
| Czech Republic | 25 | 24 | 21 | up 12,1,3 |
| United Arab Emirates | 22 | 25 | 25 | down 32,1,3 |
Of these 25 countries, 8 rose, 9 fell and 8 kept the same rank between 2020 and 20212,1. The biggest climb was Iceland’s four places, from 14th to 10th; the biggest falls were three places each for Germany and the United Arab Emirates2,1. In the 2020 edition the United States was second with 79.09 and Singapore third with 78.482. In 2021 Singapore scored 79.38 and the United States 78.811.
Rank and score tell different stories. Most countries in the group scored higher in 2021 than in 2020 even when their rank slipped, because most others rose too2,1. The model also changed between the two editions, so a score change is not a pure measure of performance. See the section on the model below.
Regions and income groups
Income and talent competitiveness are strongly and positively correlated in the 2021 table. High-income countries all rank in the upper half and take every place in the top quartile bar one1. The exception is Malaysia, 34th, the top-ranked upper-middle-income country, followed by China, 37th, and Costa Rica, 39th1. Only one lower-middle-income country makes the second quartile, Ukraine, 61st1. All low-income countries rank in the lower half, and only Gambia, 99th, and Rwanda, 101st, are even close to the middle1.
The gap shows up in every pillar. Between high-income and upper-middle-income countries, the average pillar-score gap ranges from 14.6 in Vocational and Technical Skills to 22.0 in Retain1. The smallest gap between income groups is in Attract, at 6.3 between upper-middle and lower-middle income countries and 3.7 between lower-middle and low income1.
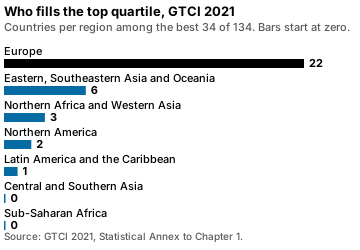
Europe is represented by 22 countries in the top quartile of 34 economies1. East and Southeast Asia and Oceania has six1. The region of Latin America and the Caribbean has one country in the top quartile for the first time in the series, Chile, 33rd1. In Sub-Saharan Africa, three countries reach the second quartile, Mauritius (56th), Botswana (66th) and South Africa (67th), while 21 countries sit in the bottom quartile1.
| Group | Best three countries |
|---|---|
| Central and Southern Asia | Kazakhstan, India, Kyrgyzstan1 |
| Latin America and the Caribbean | Chile, Costa Rica, Uruguay1 |
| Sub-Saharan Africa | Mauritius, Botswana, South Africa1 |
| Low-income countries | Gambia, Rwanda, Uganda1 |
Talent competitiveness in times of COVID
The 2021 report is built around the pandemic, and its key messages shape how the ranking reads1. Message 1 is that the pandemic shook organizations in ways that may become permanent features of tomorrow’s workplace1. Message 4 expects a K-shaped recovery in the next few years, with growth and employment uneven across sectors and levels of qualification1. Message 5 is that international inequalities have started to widen again after the pandemic1.
Recovery packages are part of the story. The European Union finalized a €806.9 billion package, NextGenerationEU, and the United States announced a US$1.9 trillion stimulus package1. In proportion to population, rich countries could mobilize four times the resources of emerging economies and about eight times those of poor ones1.
There was also encouraging news for middle-income economies. China and Russia joined the report’s league of “talent champions” in 20211. Large cities adapted better to the COVID challenges than smaller ones1. For the measures and the full set of editions, see the editions page.
How the 2021 model differs from other editions
The 2021 model has 68 variables, two fewer than the 70 indicators of the 2020 edition1. Six indicators were dropped, four new ones were added, and robot density was replaced by firms with a website1. Several World Economic Forum survey indicators were averaged over the latest four years instead of two, to reduce the COVID effect on the numbers1. The audit by the European Commission’s Joint Research Centre finds that, for the first time, all variables have a noteworthy impact on the index variance1.
| Edition | Countries | Indicators |
|---|---|---|
| GTCI 2020 | 1321 | 701 |
| GTCI 2021 | 1341 | 681 |
| GTCI 2022 | 1333 | 693 |
| GTCI 2025 | 1354 | 774 |
Each edition in the table uses a different model, so scores are best read inside one edition, with ranks as the only loose bridge between them1,3,4. The 2021 edition also adds a time-series view: it compares 2016 to 2018 with 2019 to 2021, covering 113 countries, up from 88 the year before1. That view finds the most talent-competitive countries pulling away from the rest, with the gap if anything widening1.
In that comparison the United Kingdom dropped from 7th to 11th and the Netherlands rose from 11th to 6th, Germany from 17th to 12th, and Israel from 25th to 19th1. Among the biggest improvers were China (49th to 41st), Oman (55th to 44th), Azerbaijan (62nd to 45th) and India (88th to 77th), while North Macedonia (51st to 76th), Bosnia and Herzegovina (75th to 90th) and Guatemala (80th to 92nd) lost the most ground1. Of the 45 high-income countries in the time series, 39 improved their scores1. All low-income countries are labeled talent laggards1.
For how the index is built from these indicators, see the methodology page and the guide to what the index measures. How the same top two compare across every edition is in the Switzerland and Singapore story.
Common questions
What is the Global Talent competitiveness Index (GTCI)?
The GTCI is a composite index that, in its 2021 edition, scores 134 countries on the policies and practices that develop, attract and empower the human capital behind productivity and prosperity1. It averages six pillars, four on the Input side and two on the Output side1.
RelatedGTCI 2023 ranking: top 25 and all 134 countriesGTCI editions 2013 to 2023: themes, coverage, top threeWho led the GTCI, 2013 to 2025: Switzerland, then Singapore
Sources
- The Global Talent Competitiveness Index 2021: Talent competitiveness in times of COVID-19 · INSEAD, Portulans Institute and Accenture, GTCI 2021 · globaltalentcompetitivenessindex.org · checked October 21, 2026
- The Global Talent Competitiveness Index 2020: Global talent in the age of artificial intelligence · INSEAD, the Adecco Group and Google, GTCI 2020 · globaltalentcompetitivenessindex.org · checked October 21, 2026
- The Global Talent Competitiveness Index 2022: The tectonics of talent · INSEAD, Portulans Institute and partners, GTCI 2022 · globaltalentcompetitivenessindex.org · checked October 21, 2026
- Global Talent Competitiveness Index 2025: Talent and resilience · INSEAD and Portulans Institute, GTCI 2025 · portulansinstitute.org · checked October 21, 2026
- World Competitiveness Ranking (IMD World Competitiveness Center) · IMD business school, page seen 21 Oct 2026 · imd.org · checked October 21, 2026
Image credits (2)
Published . Rankings change with every edition: each figure names its edition year and each source shows the day it was checked. How we check facts · Report an error.