On this page
- How many jobs will be lost due to automation?
- Why the studies disagree: occupations versus tasks
- Is automation a job killer or a job creator?
- Forecasts versus reality: how the task numbers aged
- Which jobs are most at risk?
- Roles that keep appearing on declining lists
- Where the new jobs are
- Jobs AI will not replace by 2030
- Who is exposed to generative AI?
- Countries and workers: where risk concentrates
- What employers and workers expect
- How to read an automation headline
- Conclusion
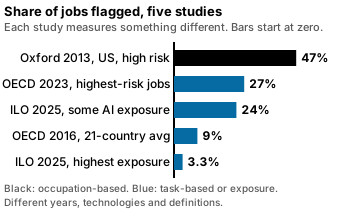
Ask how many jobs automation will replace and you get answers that differ by a factor of five. None of the numbers is wrong. Each one answers a different question: how many occupations a machine could do, how many tasks inside jobs it could do, how many workers touch a tool, or how many jobs employers expect to open and close. This page lines the studies up, shows what each one measures, and ends with the jobs that sit at both ends of the scale. For the wider argument about talent and technology, see the technology section.
How many jobs will be lost due to automation?
Seven widely cited estimates, read side by side, point in no single direction. The table gives each study’s scope and its headline figure exactly as published.
| Study | Scope | Headline figure |
|---|---|---|
| Frey and Osborne, Oxford, 2013 | 702 US occupations scored on probability of computerisation | 47% of US employment in the high-risk category1 |
| OECD working paper, 2016 | 21 OECD countries, tasks within jobs | On average 9% of jobs automatable2 |
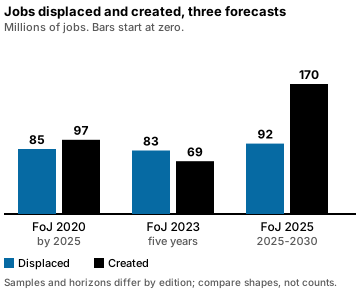
| World Economic Forum, Future of Jobs 2020 | Employer survey | 85 million jobs displaced and 97 million new roles by 20255 |
| World Economic Forum, Future of Jobs 2023 | Employer survey, next five years | 83 million lost, 69 million created, net minus 14 million or 2%4 |
| OECD Employment Outlook, 2023 | OECD countries | Highest-risk occupations about 27% of employment7 |
| World Economic Forum, Future of Jobs 2025 | Employer survey, 2025 to 2030 | 170 million created, 92 million displaced, net plus 78 million3 |
| ILO working paper 140, 2025 | World, generative AI exposure | Some exposure for 24% of jobs6 |
The Oxford and OECD 2016 figures rest on the same list of occupations and the same 2013 scores. They differ only in what they do with them2. The employer surveys, such as the Forum’s Future of Jobs Report 2025, count jobs created as well as jobs displaced, which no occupation-risk study does3. The ILO counts exposure, and it is explicit that exposure is not loss6. Setting these against one another as if they forecast the same thing is the most common error in automation headlines.
Why the studies disagree: occupations versus tasks
Frey and Osborne scored the probability of computerisation for 702 detailed occupations, and hand-labelled only 70 of them as the training set1. They put occupations above a 70% probability in a high-risk band, below 30% in a low-risk band, and the rest in between2. Their summary was that 47 percent of US employment sits in the high-risk band, meaning those occupations are potentially automatable over some unspecified number of years, perhaps a decade or two1. The wording is “potentially automatable”, which is not a forecast of job loss, and that qualifier is the first thing headlines drop.
The OECD authors relaxed one assumption. Occupations are bundles of tasks, and not every task in a bundle is easy to automate2. Working from the micro data of the OECD’s adult-skills survey, which hold job-task information, in its 2016 working paper, which records the tasks workers do, they found that even in occupations Frey and Osborne rated high risk, workers still perform tasks that are hard to automate, such as face-to-face interaction2. The result was 9% for the United States, against 47% for the same country in the Oxford paper2.
Worked example (our arithmetic). Apply each share to the same base, the 138.44 million US jobs across the 702 occupations1. The result is illustrative, because the two studies do not use the same worker counts.
| Method | Share | Applied to 138.44 million jobs |
|---|---|---|
| Occupation-based, Oxford 2013 | 47%1 | about 65 million jobs1 |
| Task-based, OECD 2016 | 9%2 | about 12.5 million jobs2 |
| Gap, 47 − 9 | 38 points1,2 | about 52.6 million jobs1,2 |
The gap is the whole debate in one line: it is the number of jobs that look doomed when you grade occupations, but ordinary once you look at the task mix inside them. Neither estimate says when, and neither counts jobs created.
The OECD paper also shows how much the occupation approach depends on assumptions. Other studies that copied the Oxford scores onto national job lists reached 35% for Finland and as high as 59% for Germany2. The task-based method reached a share between 6% in Korea and Estonia and 12% in Germany and Austria2.
Four kinds of number
The literature mixes four measures, and each answers one question and not the others.
| Measure | What it counts | What it cannot tell you |
|---|---|---|
| Occupation risk | Whole occupations a machine could in principle do | Whether the occupation’s tasks are bundled differently in practice |
| Task automatability | Share of tasks inside jobs a machine could do | How fast employers adopt, and what new tasks appear |
| Exposure | Share of tasks a tool could touch, for example generative AI | Whether employers replace or augment the worker |
| Employer expectation | Jobs employers expect to create and displace | Anything beyond the survey’s sample and horizon |
Is automation a job killer or a job creator?
On the evidence of three Future of Jobs surveys the answer depends on the year, which says more about employer mood than about technology. The 2020 edition estimated that 85 million jobs may be displaced by 20255. It also expected 97 million new roles to emerge5. The 2023 edition projected 83 million jobs lost and 69 million created over five years, a net reduction of 14 million jobs, or 2%4. The 2025 edition expects 170 million jobs created, equal to 14% of today’s employment, and displacement of 8% (92 million), a net gain of 78 million or 7%3.
Worked example (our arithmetic). Churn is displaced plus created, taken as a share of the dataset. Checking it against each report’s own figure shows how stable it is.
| Edition | Displaced plus created | Dataset | Churn |
|---|---|---|---|
| Future of Jobs 2023 | 83 + 69 = 152 million4 | 673 million employees4 | 22.6%, printed as 23%4 |
| Future of Jobs 2025 | 92 + 170 = 262 million3 | 1.2 billion formal jobs3 | 21.8%, printed as 22%3 |
Employers agree on how much turbulence is coming, a fifth of all jobs in five years, and disagree on the net sign3,4. The 2025 survey covers more than 1,000 employers representing more than 14 million workers in 22 industry clusters and 55 economies, and was run in late 20243. Treat the sign as a mood captured at one moment, not as a measurement.
The OECD’s reading of the early evidence is more cautious than either. It found that the impact of AI on job levels has been limited so far7. Adoption is at a very early stage and concentrated in the largest firms7. Many early adopters appear reluctant to dismiss staff, and adjust through slowed hiring, voluntary quits and retirement7. In a separate study cited by the OECD, of the firms adopting AI, 26% said it increased employment, against fewer than 10% that saw employment decrease7. The same chapter cites a US census sample in which just 3.2% of firms used AI between 2016 and 20187.
Forecasts versus reality: how the task numbers aged
Employer expectations of automation have been revised more than once, which makes them a useful test. The 2020 survey respondents expected almost half (47%) of business tasks to be automated within five years4. The 2023 edition found that organizations estimated 34% of business tasks were performed by machines, with the remaining 66% performed by humans4. That was a 1% increase on the 2020 estimate4. Respondents revised their expectation down to 42% of tasks automated by 20274.
The 2023 report offers a reason. The fraction of automated tasks may have risen less than expected because machines and algorithms augmented human performance rather than automating tasks in that period4. The same edition found the human-machine frontier moving at a slower pace than previously anticipated4. By 2027, task automation was expected to vary from 35% of reasoning and decision-making to 65% of information and data processing4.
The 2025 edition splits the question three ways. Respondents estimate that 47% of work tasks are mainly done by humans alone, 22% mainly by technology and 30% by a combination3. By 2030 the global estimate for tasks done mainly by technology is 34%3. The share augmented by technology is 33% globally3.
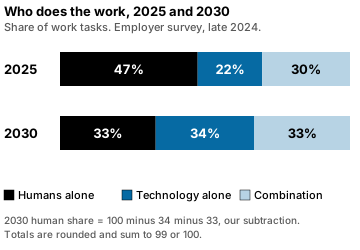
Worked example (our arithmetic). The report prints the 2030 shares for technology and for the combination, not for humans alone. Subtracting gives the human-only share and a check against the report’s own total3.
| Step | Result |
|---|---|
| Technology alone in 2030 | 34%3 |
| Combination in 2030 | 33%3 |
| Humans alone, 100 − 34 − 33 | 33%3 |
| Fall from 47% in 2025 | 14 points, which fits the report’s nearly 153 |
Of that nearly 15-point reduction in the human share, nearly 82% is attributable to advancing automation and 19% to expanded human-machine collaboration3. Our arithmetic: 82 + 19 = 101, a rounding artefact. The sectors differ sharply. In insurance and pensions management and in telecommunications, more than 95% of the fall in human-only tasks is expected to come from deeper automation3. In medical and healthcare services and in government, nearly half of the fall is expected from augmentation and collaboration instead3.
The Forum adds a caveat the headlines omit. The task-share analysis does not consider any change in the absolute amount of work getting done, so any concern about humans “running out of things to do” would be misplaced3.
Which jobs are most at risk?
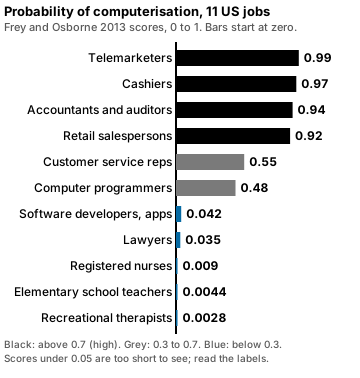
The Oxford paper is the only source here that scores individual occupations, and its table makes the pattern clear. The scores below are from the 2013 paper’s ranked list of 702 occupations, where 1 would mean certain computerisation1.
| Occupation | Probability of computerisation, 2013 | Band |
|---|---|---|
| Telemarketers | 0.991 | High |
| Tax preparers | 0.991 | High |
| Cashiers | 0.971 | High |
| Accountants and auditors | 0.941 | High |
| Retail salespersons | 0.921 | High |
| Fast food preparation and serving workers | 0.921 | High |
| Customer service representatives | 0.551 | Medium |
| Computer programmers | 0.481 | Medium |
| Applications software developers | 0.0421 | Low |
| Lawyers | 0.0351 | Low |
The bands are the OECD’s description of the authors’ cut-offs: low risk under 30%, medium 30 to 70% and high above 70%2. Two points follow. First, the high band is full of routine administrative and sales work: the paper names cashiers, counter and rental clerks and telemarketers among the high-risk sales occupations1. Second, wages and education run opposite to risk. The authors find a strong negative relationship between wages, education and the probability of computerisation1, and the OECD’s later work reaches the same direction: it is mostly low-skilled and low-income workers who face a high risk of being automatable2.
The two ends of the ranking show the same split at its sharpest.
| Rank of 702 | Occupation | Probability, 2013 |
|---|---|---|
| 1 | Recreational therapists | 0.00281 |
| 3 | Emergency management directors | 0.0031 |
| 5 | Audiologists | 0.00331 |
| 6 | Occupational therapists | 0.00351 |
| 13 | Choreographers | 0.0041 |
| 651 | Dental laboratory technicians | 0.971 |
| 659 | Motion picture projectionists | 0.971 |
| 696 | Cargo and freight agents | 0.991 |
| 697 | Watch repairers | 0.991 |
| 698 | Insurance underwriters | 0.991 |
| 701 | Title examiners, abstractors and searchers | 0.991 |
| 702 | Telemarketers | 0.991 |
The same table also shows the model’s age. The 2013 authors judged that perception and manipulation remained hard challenges for robots1. That was written before generative AI, and the newer evidence from the ILO moves the exposure list toward clerical and professional work, discussed below. The Forum’s 2025 survey agrees in direction: clerical and secretarial workers, including cashiers and ticket clerks and administrative assistants and executive secretaries, are expected to see the largest decline in absolute numbers3. The fastest-declining roles include postal service clerks, bank tellers and data entry clerks3. Graphic designers and legal secretaries sit just outside the top 10 fastest-declining, a first-time prediction that the Forum reads as generative AI’s growing capacity for knowledge work3.
Customer service representatives
Customer service sits in the exposed middle in every source that mentions it. Frey and Osborne scored customer service representatives at 0.55, medium risk and well below telemarketers at 0.991. Client information and customer service workers ranked seventh among roles in decreasing demand in the Forum’s 2020 survey5, and are among the 15 largest net declines in absolute numbers in its 2025 survey3. Exposed roles such as clerical, financial and customer service jobs are concentrated in higher-income countries6. Yet the skill itself is not fading: service orientation and customer service are among the skills that have grown in relevance in the Forum’s survey3. The job that answers the phone is exposed, while the judgement behind good service is not.
Retail
Retail shows how one sector can sit on both lists. Frey and Osborne scored retail salespersons at 0.92 and cashiers at 0.97, both firmly high risk1. The Forum’s 2023 and 2025 surveys expect cashiers and ticket clerks to fall fast4,3. Yet salespersons are also named among the frontline roles expected to add the largest numbers of jobs in absolute terms by 2030, with farmworkers, delivery drivers, construction workers and food processing workers3. Editor’s reading: the two forecasts can sit together because checkout work and selling work are different tasks, but no source breaks the retail job down that way.
Roles that keep appearing on declining lists
Two Forum surveys five years apart give a rare comparison. The 2020 edition ranked roles in decreasing demand across industries, and the 2025 edition ranks the fastest net declines. The two rankings use different criteria and samples, so ranks are not comparable one for one. The names are5,3.
| Rank | 2020 survey, decreasing demand | 2025 survey, fastest declining |
|---|---|---|
| 1 | Data entry clerks | Postal service clerks5,3 |
| 2 | Administrative and executive secretaries | Bank tellers and related clerks5,3 |
| 3 | Accounting, bookkeeping and payroll clerks | Data entry clerks5,3 |
| 4 | Accountants and auditors | Cashiers and ticket clerks5,3 |
| 5 | Assembly and factory workers | Administrative assistants and executive secretaries5,3 |
| 6 | Business services and administration managers | Printing and related trades workers5,3 |
| 7 | Client information and customer service workers | Accounting, bookkeeping and payroll clerks5,3 |
| 8 | General and operations managers | Material-recording and stock-keeping clerks5,3 |
| 9 | Mechanics and machinery repairers | Transportation attendants and conductors5,3 |
| 10 | Material-recording and stock-keeping clerks | Door-to-door sales workers, news and street vendors5,3 |
Four roles sit on both lists: data entry clerks, administrative and executive secretaries, accounting, bookkeeping and payroll clerks, and material-recording and stock-keeping clerks5,3. Data entry clerks were first in 2020 and are third in 20255,3. Administrative and executive secretaries moved from second to fifth5,3. Record-keeping and administrative work is the stable core of every declining list. In 2020 the same Forum survey expected increasingly redundant roles to fall from 15.4% of the workforce to 9% by 2025, and emerging roles to grow from 7.8% to 13.5%5.
Where the new jobs are
The Forum’s 2025 survey expects growth in three families of work. Frontline roles are predicted to see the largest growth in absolute terms of volume3. Farmworkers top the list, with 35 million more jobs expected by 2030 in a role that currently employs more than 200 million workers worldwide3. Care economy jobs, such as nursing professionals, social work and counselling professionals and personal care aides, are also expected to grow significantly3. Technology roles grow fastest in percentage terms, including big data specialists, fintech engineers, AI and machine learning specialists and software and application developers3.
The same two surveys give the growth side. Again the criteria differ, and again the names recur.
| Rank | 2020 survey, increasing demand | 2025 survey, fastest growing |
|---|---|---|
| 1 | Data analysts and scientists | Big data specialists5,3 |
| 2 | AI and machine learning specialists | Fintech engineers5,3 |
| 3 | Big data specialists | AI and machine learning specialists5,3 |
| 4 | Digital marketing and strategy specialists | Software and applications developers5,3 |
| 5 | Process automation specialists | Security management specialists5,3 |
| 6 | Business development professionals | Data warehousing specialists5,3 |
| 7 | Digital transformation specialists | Autonomous and electric vehicle specialists5,3 |
| 8 | Information security analysts | UI and UX designers5,3 |
| 9 | Software and applications developers | Light truck or delivery services drivers5,3 |
| 10 | Internet of things specialists | Internet of things specialists5,3 |
Big data specialists, AI and machine learning specialists, software and applications developers and internet of things specialists appear on both lists5,3. The growth side has been consistent for five years, and it is the technology-building side5,3.
In skills terms, AI and big data top the list of fastest-growing skills, followed closely by networks and cybersecurity as well as technology literacy3. Employers also expect creative thinking, resilience and curiosity to rise alongside technical skills3. Manual dexterity, endurance and precision, and reading, writing and mathematics are expected to lose relevance as digital access, AI and robotics automate these tasks3. The 2017 edition of the GTCI had made the same pairing its third message, that technical skills plus social and project competence form the new talent profile8.
Jobs AI will not replace by 2030
No source provides a list of safe jobs, and the question assumes a certainty that none of the forecasts claims. What the sources do support is a description of the low-risk end. In the Oxford ranking of 2013 the lowest probabilities belong to recreational therapists at 0.0028 and mental health and substance abuse social workers at 0.00311. Elementary school teachers score 0.0044 and registered nurses 0.0091. The OECD’s 2023 work agrees that high-skill occupations have the lowest risk of automation7. It also finds high-skill jobs the most exposed to advances in artificial intelligence, a difference worth holding onto: exposure means the tool can do part of the work, and risk means it may replace the worker7. AI can already answer 80% of the literacy questions of the OECD adult-skills survey, and two-thirds of its numeracy questions7.
The common thread is the bottleneck tasks. Frey and Osborne judged that perception and manipulation remained hard, and the paper’s other limiting factors, creative and social intelligence, sit behind the same low scores1. Care and education roles are the ones the Forum expects to grow3. A low score is not a promise. The 2025 ILO paper shows that some strongly digitised occupations have increased exposure as the tools improve6.
Who is exposed to generative AI?
The ILO’s 2025 working paper is the newest measure and takes the third view, exposure, as opposed to prediction. Globally, one in four workers are in an occupation with some generative AI exposure, and 3.3% of global employment falls into the highest exposure category6. The revised estimates are lower than the ILO’s 2023 paper, though still one in four jobs globally (24%) has some degree of exposure6.
The paper’s finding for the job-killer question is its most useful line. As most occupations consist of tasks that require human input, transformation of jobs is the most likely impact of generative AI6. Exposure does not imply the immediate automation of an entire occupation, but the potential for a large share of its tasks to be performed with the technology6. Clerical occupations continue to have the highest exposure6.
The pattern by country income runs opposite to what many readers expect. Overall exposure is 11% of total employment in low-income countries against 34% in high-income countries6. Women are more exposed at the top: in high-income countries 9.6% of female employment sits in the highest gradient, against 3.5% of male6. The ILO sorts exposed occupations into four gradients, summarized below6.
| Gradient | What it means |
|---|---|
| 1 | Low overall exposure but significant variability across tasks6 |
| 2 | Moderate exposure, a mix of highly exposed and minimally exposed tasks6 |
| 3 | A significant portion of tasks consistently exposed6 |
| 4 | The highest share of tasks exposed, with high consistency across tasks6 |
| The method rests on a survey of 1,640 employed people in Poland who scored task automation potential6. |
Countries and workers: where risk concentrates
The OECD’s 2016 task-based analysis found that the share of jobs at high risk is highest in Germany and Austria (12%) and lowest in Korea and Estonia (6%)2. Countries with a strong focus on high-qualified workers typically have lower shares at high risk, since these workers perform fewer automatable tasks2. One caution from the paper: a country can look more automatable than another simply because the other has already automated and replaced labour with capital2.
The OECD’s Employment Outlook 2023 adds a country ranking for the highest-risk occupations. Luxembourg, the United Kingdom and Sweden have the lowest shares of employment in those occupations, while Hungary, the Slovak Republic and the Czech Republic have the highest shares7. It finds that low- and middle-skilled jobs are the most at risk, including construction and extraction, farming, fishing and forestry, and to a lesser extent production and transportation7.
The information technology sector is leading the way in AI adoption, while industries such as construction are lagging behind3. Austria expects 42% of tasks augmented by technology by 2030, against a global average of 33%3. The Forum’s survey adds the employers’ side. Process and task automation is the second most common workforce strategy, at 73% of employers, and is more pronounced in high-income economies (77%) than in upper-middle-income (74%)3. Employers expecting to be affected by ageing populations are more likely to accelerate process automation, 79% against 73% globally3. Global robot density reached 162 units per 10,000 employees in 2023, double the number measured seven years earlier3. The GTCI itself added robot density and investment in emerging technologies in its 2020 edition, as a Technology Adoption component9. For how that fits the model, see what the index measures and its methodology.
What employers and workers expect
Employers’ stated plans, set side by side, show where the two surveys asked about the same thing5,3.
| Plan | 2020 survey | 2025 survey |
|---|---|---|
| Accelerate automation of tasks | 50% of companies5 | 73% of employers3 |
| Reduce the current workforce | 43%5 | 40% where AI can automate tasks3 |
| Redeploy displaced workers | Nearly 50% hoped to5 | Not asked in the same form |
| Upskill the workforce | Not in the same form | 85%3 |
| Hire staff with new skills | Not in the same form | 70%3 |
| Augment the workforce with new technologies | Not in the same form | 63%3 |
The two surveys word these questions differently and sample different employers, so the table lines up topics, not trends. Within the 2025 survey, half of employers plan to reorient their business in response to AI, two-thirds plan to hire talent with specific AI skills, and 40% anticipate reducing their workforce where AI can automate tasks3. Skill gaps are the biggest barrier to business transformation, cited by 63% of employers3. The OECD found the same obstacle from the other side: two in five companies say a lack of relevant skills is a barrier to using AI at work7.
Workers are less uniformly gloomy than the headlines. The OECD surveyed over 2,000 employers and 5,300 workers in the manufacturing and finance sectors of seven OECD countries in 20227. Nearly two-thirds (63%) of workers reported that AI had improved their enjoyment at work, because it automated dangerous or tedious tasks7. Yet 60% of workers are also worried about losing their jobs to AI in the next ten years7. Employers in the same survey said AI had raised the importance of specialised AI skills, and raised the importance of human skills even more7.
The GTCI’s 2017 foreword went further and said that, with today’s rapid technological change, the Luddite fallacy is now perhaps less of a fallacy8. The same edition added an Employability sub-pillar to its model, measuring the extent of skill gaps and labour market mismatches in each country8. The GTCI’s 2017 edition framed the stakes in the same terms. Its first message was “Think beyond automation”8. It said many unskilled jobs would continue to be automated, through the replacement of humans by robots and algorithms empowered by big data8, and that low-skilled workers continue to be replaced by robots while knowledge workers are displaced by algorithms8. The 2020 edition, on artificial intelligence, concluded that AI in the workplace requires a massive re-skilling of the workforce, and that human-AI teams could be more productive than either AI or workers alone9. The longer story of that theme is on the talent and technology page. The skills side of the same problem is in skills mismatch, and the cross-border side in international talent mobility.
How to read an automation headline
Five questions sort most claims.
- Which kind of number is it? Occupation risk, task automatability, exposure or an employer expectation, as in the four-way table above.
- What is the base? Jobs in a survey dataset, the whole workforce, or the formal sector3,4.
- What is the horizon? The Oxford paper gives “a decade or two”1. The Forum’s surveys give five years3.
- Does it count creation? Only the employer surveys do3.
- How old is it? Employer forecasts from 2020 and 2023 were revised within three years4.
An editor’s rule of thumb: when a headline says “X million jobs lost” and the source is an exposure index or an occupation score, the headline has quietly turned a risk into a forecast.
Conclusion
The evidence supports three statements and no more. Estimates of the share of jobs at risk fall between 9% and 47% because they measure different things, and the task-based figure is the more cautious one1,2. Employer surveys expect large churn, near a fifth of jobs over five years, with a net sign that has flipped between editions3,4. And the most recent exposure data point to clerical and routine administrative work, with transformation, not disappearance, as the likelier outcome for most occupations6,7.
What the sources do not support is a single number for jobs lost, a date, or a list of survivors. The honest answer to “how many jobs will automation replace?” is a range, a method and a caveat, in that order.
Common questions
Read next
Talent and technology
Talent and technology shaping the future of work
The Global Talent Competitiveness Index 2017 made technology its theme. Its seven messages on automation, skills and work, tested against WEF, ILO and OECD.
How the index works
What is the Global Talent Competitiveness Index (GTCI)?
What the GTCI talent ranking measures, how its six pillars and 0 to 100 scores are built, who publishes it and how it differs from other rankings.
How the index works
GTCI methodology: how the score is calculated
How the GTCI turns 77 indicators into one score: sources, coverage rules, outliers, 0 to 100 scaling, equal weights and the JRC audit, with worked examples.
Sources
- The Future of Employment: How Susceptible Are Jobs to Computerisation? · Carl Benedikt Frey and Michael Osborne, University of Oxford, 2013 · oxfordmartin.ox.ac.uk · checked October 21, 2026
- The Risk of Automation for Jobs in OECD Countries: A Comparative Analysis (Working Paper 189) · OECD, Arntz, Gregory and Zierahn, 2016 · oecd.org · checked October 21, 2026
- Future of Jobs Report 2025 · World Economic Forum, January 2025 · www3.weforum.org · checked October 21, 2026
- Future of Jobs Report 2023 · World Economic Forum, 2023 · www3.weforum.org · checked October 21, 2026
- The Future of Jobs Report 2020 · World Economic Forum, October 2020 · www3.weforum.org · checked October 21, 2026
- Generative AI and Jobs: A Refined Global Index of Occupational Exposure (ILO Working Paper 140) · International Labour Organization, May 2025 · ilo.org · checked October 21, 2026
- OECD Employment Outlook 2023: Artificial Intelligence and the Labour Market · OECD, 2023 · oecd.org · checked October 21, 2026
- The Global Talent Competitiveness Index 2017: Talent and technology · INSEAD, Adecco Group and HCLI, GTCI 2017 · globaltalentcompetitivenessindex.org · checked October 21, 2026
- The Global Talent Competitiveness Index 2020: Global talent in the age of artificial intelligence · INSEAD, the Adecco Group and Google, GTCI 2020 · globaltalentcompetitivenessindex.org · checked October 21, 2026
Image credits (4)
Published . Rankings change with every edition: each figure names its edition year and each source shows the day it was checked. How we check facts · Report an error.