On this page
- What does international mobility mean?
- Counting migrants: the global stock
- Where do migrants live?
- What happened in 2024? Flows into OECD countries
- Health professionals: talent mobility in one occupation
- Which countries attract talent?
- Brain drain, brain gain, brain circulation
- How to read a talent mobility statistic
- Editor’s verdict
Talent mobility sounds like a recruiter’s term, yet the published numbers behind it come from statistical offices, labour economists and the countries that count arrivals at the border. Put together, they show a world where very few people live outside their birth country, where a handful of destinations hold a large share of those who do, and where 2024 was a year of slowdown after a post-pandemic surge1,3. This page sets out the definitions and the numbers, then the two rankings that try to say which countries attract skilled people. For the wider topic, see the skills section, skills mismatch and the automation guide.
What does international mobility mean?
International mobility is people moving across borders, and the rest is detail. The UN’s statistical definition of an international migrant makes no reference to the reason for migration or the legal immigration status of the person changing country of residence1. A person counts as an international migrant by country of birth or country of citizenship, and birth data take precedence when they are available1. Everything below builds on that counting rule.
“Talent” narrows the frame to skilled people, and the index literature adds more structure. The GTCI’s 2015-16 edition, whose theme was Talent Attraction and International Mobility, notes that people moving across borders differ on four main dimensions5. Motive covers economic migrants, family reunification and refugees, and duration separates short-term from long-term movement5. The other two are skills, from low to high, and legal status5.
| Dimension | Range |
|---|---|
| Motive | Economic migrants seeking employment, family reunification, refugees5 |
| Duration | Short-term or long-term, longer-term being temporary or permanent5 |
| Skills | Low skills to high skills, with a wide spectrum between5 |
| Legal status | Legal migration with a visa or permit, or illegal migration5 |
A statistic about “migrants” mixes all four. A statistic about “talent” mixes fewer, but no source here isolates it cleanly, so each number below carries its own scope.
Counting migrants: the global stock
There were 304 million international migrants in 2024 in the UN Population Division’s migrant stock data, a number that has nearly doubled since 1990, when there were an estimated 154 million1. Their share of the world’s people is small: in 2024, 3.7 per cent of people globally were international migrants, up only modestly from 2.9 per cent in 19901. The share is far below one per cent in the two Asian regions that hold more than half the world’s people, namely Central and Southern Asia and Eastern and South-Eastern Asia1.
The labour force version is the closest published proxy for working talent. The ILO’s global estimates on international migrant workers put 167.7 million migrants were in the global labour force in 2022, over 30 million more than in 20132. The global stock of migrants reached 284.5 million that year, with 255.7 million of working age2. Migrants were 4.7 per cent of the global labour force and 4.3 per cent of the working-age population2. Of the 167.7 million, 155.6 million were employed and 12.1 million unemployed2.
Worked example (our arithmetic). The two ILO stock figures give the share of migrants who work or look for work2.
| Base | Migrants | Labour force | Share |
|---|---|---|---|
| All migrants | 284.5 million2 | 167.7 million2 | 58.9% |
| Migrants of working age | 255.7 million2 | 167.7 million2 | 65.6% |
Roughly two in three migrants of working age are in the labour force. The remainder is outside it, and no source here splits that group.
Women made up 38.7% (64.9 million) of the migrant labour force and men 61.3% (102.7 million)2. High-income countries held 68.4 per cent of it (114.7 million), and upper-middle-income countries 17.4 per cent (29.2 million)2. Part of the pattern is policy: some countries favour skilled workers or those who already have job offers, which can lead to higher labour force participation among migrants2.
Where do migrants live?
Europe hosted more international migrants than any other region in 2024, with 94 million, ahead of Northern America with 61 million and Northern Africa and Western Asia with 54 million1. Europe also added the most since 1990, 43 million1. Northern America’s growth has slowed, to under one per cent a year between 2020 and 20241. Migrants are 21 per cent of residents in Oceania, 16 per cent of Northern America’s 385 million people and 13 per cent of Europe’s 745 million1.
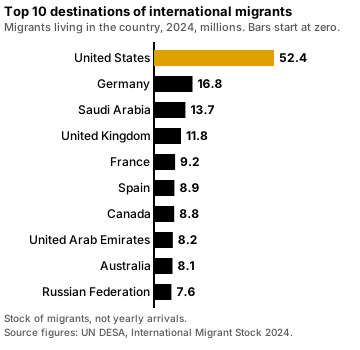
One country stands apart. The United States hosted 52.4 million international migrants in 2024, more than any other country1.
| Place | Country | Migrants hosted, 2024 |
|---|---|---|
| First | United States | 52.4 million1 |
| Second | Germany | 16.8 million1 |
| Third | Saudi Arabia | 13.7 million1 |
| Fourth | United Kingdom | 11.8 million1 |
| Fifth | France | 9.2 million1 |
| Sixth | Spain | 8.9 million1 |
| Seventh | Canada | 8.8 million1 |
| Eighth | United Arab Emirates | 8.2 million1 |
| Ninth | Australia | 8.1 million1 |
| Tenth | Russian Federation | 7.6 million1 |
These are stocks, meaning everyone living abroad at the date, not yearly arrivals. A 2024 stock says nothing about how skilled the migrants are1.
Movement is also regional: in 2024, 45 per cent of international migrants worldwide were living in their region of origin1. The largest corridor between regions runs from Latin America and the Caribbean to Northern America, with 27 million people1.
What happened in 2024? Flows into OECD countries
Permanent migration to OECD countries fell by 4% in 2024, in the OECD’s International Migration Outlook 2025, after three years of sharp post-pandemic growth3. The 6.2 million new permanent immigrants were still historically high, 15% above 2019 levels3. Family migration represented 44% of permanent flows, labour migration 17% and humanitarian migration 13%3. The part that changed most was labour: it declined by 21% after a sustained increase since 20203. Even so, permanent and temporary labour migration remained 32% and 26% above 2019 levels respectively3.
Temporary labour migration is concentrated. About 70% of temporary labour migrants to OECD countries went to just four destinations in 2024: the United States, Australia, Japan and Canada, with the United States alone receiving over one-third (36%)3. India has been the main country of origin of migration flows to OECD countries since 2020, Ukraine aside, with about 600 000 Indian citizens immigrating into an OECD country in 2023, 8% more than in 20223.
The student pipeline
International students are the entry route that governments can turn on and off, and 2024 shows it. OECD countries welcomed over 1.8 million new international tertiary-education students, 13% fewer than in 20233. The four largest destinations all lost: the United States (390 000, down 12%), the United Kingdom (389 000, down 14%), Canada (213 100, down 39%) and Australia (182 000, down 22%)3. Elsewhere flows rose: international students to other OECD countries increased by 5%, with Denmark, Korea, New Zealand and Sweden up between 14 and 19%3. Japan welcomed about 167 000 new international students, a 20% increase3. European OECD countries excluding the United Kingdom welcomed approximately 435 0003.
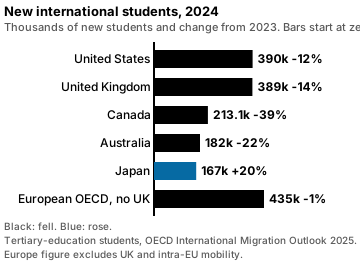
Worked example (our arithmetic). Reversing each printed percentage gives an approximate 2023 intake, and the sum shows how much the four big destinations lost together. The results are approximate because the percentages are rounded3.
| Destination | New students 2024 | Change | Implied 2023 |
|---|---|---|---|
| United States | 390 0003 | down 12%3 | about 443 000 |
| United Kingdom | 389 0003 | down 14%3 | about 452 000 |
| Canada | 213 1003 | down 39%3 | about 349 000 |
| Australia | 182 0003 | down 22%3 | about 233 000 |
| Four together | about 1 174 0003 | about 1 478 000 |
The four lost about 304 000 new students between them, roughly one in five of their 2023 intake, while the OECD total fell 13%3. The next section turns from students to a profession where mobility is structural.
Health professionals: talent mobility in one occupation
Doctors and nurses are the best-documented skilled group. In 2020-2021 there were more than 830 000 foreign-born doctors and 1.75 million foreign-born nurses working in the OECD, about one-quarter and one-sixth of the workforce in each occupation3. Foreign-trained doctors and nurses numbered 606 000 (18.4%) and 733 000 (8.3%) in 2021-20233.
| Measure | Doctors | Nurses |
|---|---|---|
| Foreign-born workers in the OECD, 2020-2021 | More than 830 0003 | 1.75 million3 |
| Foreign-trained, 2021-2023 | 606 000, 18.4%3 | 733 000, 8.3%3 |
| Change in foreign-born numbers | Up 86%3 | Up 136%3 |
| Main origin regions and countries | India, Germany, China3 | Philippines, India, Poland3 |
| OECD workforce in 2023 against 2000 | Over 4.5 million against 2.8 million3 | 12.3 million against 8.1 million3 |
The share of migrant doctors increased by seven percentage points over two decades, from 21% to 28%3. Asia is the main region of origin, with approximately 40% of foreign-born doctors and 37% of nurses3. The cost sits at the origin end: about 89 000 doctors and 257 000 nurses originate from countries on the WHO Health Workforce Support and Safeguards List3. The OECD flags the possible impact on the fragile health systems of those countries3.
Migrants do not receive an even deal. Immigrants entering the labour market earn 34% less than native-born workers, mainly because they work in lower-paying sectors and firms3. The same OECD edition adds that the gap narrows over time3.
Which countries attract talent?
Two rankings answer this, and they answer different questions.
The OECD Indicators of Talent Attractiveness (2023 edition) rank OECD countries only, from a framework of seven dimensions, equal-weighted by default4. It scores three profiles: workers, entrepreneurs and students4. A first edition appeared in 2019, so the 2023 update allows comparison over time4.
| Profile, 2023 | Top OECD countries |
|---|---|
| Highly qualified workers | New Zealand, Sweden, Switzerland, Australia, then Norway4 |
| Entrepreneurs | Sweden, Switzerland, Canada, Norway, New Zealand4 |
| International students | United States, Germany, United Kingdom, Norway, Australia4 |
Sweden and Switzerland are characterised by inclusive and family-friendly societies with a high standard of living and a strong skills environment4. The United Kingdom has seen the largest improvement since 2019, due among other things to having abolished the quota for highly skilled workers and to strong labour market outcomes for migrants4. Policy moves in the other direction too: France raised fees for international students, and Canada and New Zealand tightened capital requirements for entrepreneurs4. Admission rules matter more than the other dimensions: high barriers to admission make the other dimensions of attractiveness less compelling4.
The GTCI covers 135 countries with 77 indicators in its 2025 edition6. Its Attract pillar includes an External Openness sub-pillar that counts migrant stock, international students and brain gain, and the 2025 edition added AI skills migration6. The 2025 results favour a different group of countries. The United Arab Emirates ranks 3rd worldwide in the Attract pillar, behind only Luxembourg and Singapore, while Qatar (7th) and Kuwait (16th) also feature prominently6. Five of the top ten economies in External Openness are from Northern Africa and Western Asia6.
| GTCI 2025 | Result |
|---|---|
| United Arab Emirates, 25th overall | 2nd in External Openness; 1st in migrant stock and international student inflows; 2nd in brain gain; 3rd in AI skills migration6 |
| Saudi Arabia | 57th in Attract and 43rd in External Openness, with migrant stock 9th and AI skills migration 8th6 |
| Qatar | 7th in the Attract pillar6 |
| Kuwait | 16th in the Attract pillar6 |
The two rankings do not conflict. The OECD set is wealthy democracies with immigration systems that scout for skilled people. The GTCI measures openness across 135 countries, and its External Openness counts the stock of migrants and students already present6. Editor’s reading: that design suits economies where migrants and students are a large share of residents, as in the Gulf. The AI indicators cover approximately 35% of countries, so that part of the 2025 index rests on thin data6.
Brain drain, brain gain, brain circulation
The GTCI’s 2015-16 edition reframed the debate. The term brain drain was coined in the UK for the emigration of scientists and technologists from Europe to North America after the war5. The metaphors of brain drain and brain gain give a very limited view of the economic implications of migration5. The edition proposes brain circulation instead, as a more appropriate term for the potential benefits for countries of destination, transit and origin alike5.
Two ideas in that edition still hold up against the 2024 data. First, temporary economic mobility of high-skilled people is the key to understanding brain circulation5. The 2024 figures bear this out: temporary labour migration is large, and four destinations absorb about 70% of it3. Second, nations should do a much better job of disaggregating high-skilled and non-skilled immigration policies5. Taiwan is the edition’s model case: it built its world-leading electronics industry through returnees from Silicon Valley who had left decades before in a massive brain drain exodus5.
The 2015-16 edition also stated why it mattered: as globalisation deepens, talent mobility becomes an important element of dynamism, innovativeness and competitiveness5. The 2014 edition had identified openness as a key ingredient to talent competitiveness5. Migration itself is the result of push factors that lead people to emigrate and pull factors that determine where they wish to move5. Health workers show the strongest form of the tension: the destination gains staff, and the origin may lose capacity it cannot replace3. Whether circulation or drain wins depends on whether people come back, send skills home or never return, and none of the sources here measures return at scale.
How to read a talent mobility statistic
- Stock or flow? The 304 million is a stock of people living abroad1. The 6.2 million is a yearly flow of new permanent immigrants into OECD countries3.
- Who is counted? The UN definition ignores the reason for moving and legal status1. The ILO counts migrants in the labour force, employed or unemployed2.
- Which countries? OECD flow figures cover OECD members, not the world3.
- Which year and which edition? Every ranking here names its year: OECD talent attractiveness 2023, GTCI 20254,6.
- Is it skilled? Migrant stocks do not separate skilled from unskilled1. Only the health-professional and student series do.
Editor’s verdict
Talent mobility is smaller and more concentrated than the headlines suggest. The 304 million migrants are 3.7 per cent of the world’s people, and one country hosts 52.4 million of them1. The skilled flows that governments compete for run through a few doors: students, health workers, and temporary labour channels where four destinations take about 70%3. Those doors can narrow in a single year, as new students fell 13% in 2024 and labour migration fell by 21%3. And no single ranking says who attracts talent best: the OECD’s 2023 profile favours New Zealand, Sweden and Switzerland, the GTCI’s 2025 Attract pillar favours Luxembourg, Singapore and the United Arab Emirates4,6. A reader who wants to compare countries should name the profile, the edition and the measure every time.
Common questions
What does "international mobility" mean?
People moving across borders, whether to study, work, join family or flee, for a short or long time. The UN's statistical definition of an international migrant ignores the reason and legal status, using country of birth or citizenship1. Talent mobility is the skilled share of that movement.
Read next
Talent and technology
How many jobs will automation replace? Studies compared
Estimates run from 9% to 47% of jobs, from 85 million displaced to 170 million created. Why Oxford, OECD, ILO and WEF disagree, and which jobs sit where.
Skills and mobility
Skills mismatch: OECD definitions, data and costs
What skills mismatch means, how the OECD and ILO measure it, how many workers are affected by country, what it costs in wages and productivity, and what helps.
How the index works
GTCI pillars: Enable, Attract, Grow, Retain, VT and GA
What each of the six Global Talent Competitiveness Index pillars measures, which sub-pillars and indicators sit under it and who led it in 2025.
Sources
- International Migrant Stock 2024: Key facts and figures · United Nations Department of Economic and Social Affairs, Population Division, January 2025 · un.org · checked October 21, 2026
- ILO Global Estimates on International Migrant Workers: International migrants in the labour force (fourth edition) · International Labour Organization, December 2024 · ilo.org · checked October 21, 2026
- International Migration Outlook 2025 (49th edition) · OECD, November 2025 · oecd.org · checked October 21, 2026
- What is the best country for global talents in the OECD? (Migration Policy Debates No. 30) · OECD, March 2023 · oecd.org · checked October 21, 2026
- The Global Talent Competitiveness Index 2015-16: Talent Attraction and International Mobility · INSEAD, Adecco Group and HCLI, GTCI 2015-16 · globaltalentcompetitivenessindex.org · checked October 21, 2026
- Global Talent Competitiveness Index 2025: Talent and resilience · INSEAD and Portulans Institute, GTCI 2025 · portulansinstitute.org · checked October 21, 2026
Image credits (2)
Published . Rankings change with every edition: each figure names its edition year and each source shows the day it was checked. How we check facts · Report an error.