On this page
The phrase is often used loosely, for any complaint that hiring is hard. The measurement literature is narrower and more useful. It separates what a worker can do from the diploma on the wall, and both from whether employers can hire at all. This page defines the terms the OECD and the ILO use, lays out how each is measured, compares the numbers by country, and ends with the evidence on cost and cure. The wider skills agenda is in the skills section.
What is skills mismatch?
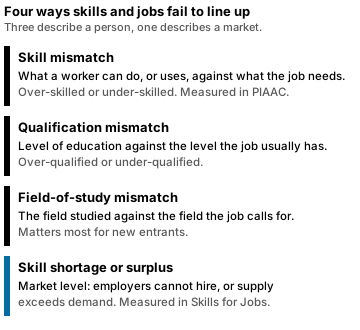
Skills mismatch is the sub-optimal use of an individual’s skills in their occupation, a situation that can bring dissatisfaction for workers and hold back productivity growth3. The ILO’s wording is a discrepancy between the skills that are sought by employers and the skills that are possessed by individuals6. Both definitions concern a gap, but they do not say where it sits, and that matters. The literature uses four terms that people often treat as synonyms.
| Term | What it compares | Defined by |
|---|---|---|
| Skill mismatch | A worker’s skills, or the use of them, against what the job needs | The sub-optimal use of an individual’s skills in the occupation3 |
| Qualification mismatch | A worker’s qualification against the one the job usually requires, in level or field | A job that does not match someone’s qualification in terms of field or level4 |
| Field-of-study mismatch | The field studied against the field the job calls for | Alignment between a worker’s specialisation and the field of employment4 |
| Skill shortage or surplus | Labour-market supply against demand for a skill | Shortage: employers cannot recruit staff with the necessary skills at the going rate of pay and working conditions4 |
The OECD adds a caution that readers of headlines miss. A qualification mismatch does not always imply a skills mismatch, because people can hold more or different skills than their highest qualification certifies4. A difference in skill level within an occupation is likewise not enough to infer that a mismatch exists3. The sections below keep the four terms apart.
How the OECD and ILO measure it
Three instruments carry most of the published numbers, and the OECD Survey of Adult Skills working paper is the starting point.
The Survey of Adult Skills (PIAAC). It assesses adults aged between 16 and 65 in literacy, numeracy and problem solving in technology-rich environments1. Answers are used to create a quantitative scale of the skills required to perform the job in each occupation1. A 2013 OECD paper combined skill proficiency, self-reported mismatch and skill use into one measure2.
The OECD Skills for Jobs database. Its 2022 key insights work at market level. An occupational imbalance indicator is calculated for 42 occupation groups, from five sub-components: median wage growth, employment growth, hours worked growth, change in unemployment rate and change in the under-qualification rate4. The 2022 edition covers 43 OECD countries and partner economies4. It maps occupations to skills with online job postings: more than 17 000 skill keywords are classified into 56 detailed categories, grouped into 14 broad ones4. The postings cover 2012 to 2019 for six English-speaking countries4.
The ILO’s version. The ILO Skills for Jobs Database extends the OECD approach to low- and middle-income countries6. It tracks proxies such as hourly wage growth, employment growth, the unemployment rate, growth in hours worked and under-qualification growth6. An ILO statistics presentation sets the concepts out: qualification mismatch covers persons in employment whose jobs have qualification requirements that do not correspond to their formal qualifications5.
A qualification requirement is not a legal standard. The OECD computes it as the most common highest educational attainment of workers in each occupation in each country at a given time4. So over-qualified means “holds more than most people in that job”, which is a relative statement4.
How common is skills mismatch?
It depends on the yardstick, and the table shows why it is worth giving the yardstick every time.
| Yardstick | Result | Year |
|---|---|---|
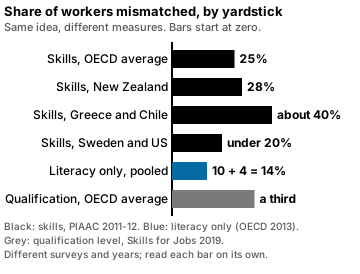
| Skills mismatch, OECD average | 25%, with 18% over-skilled and 7% under-skilled1 | 2011-12 |
| Skills mismatch, New Zealand | 28%1 | 2011-12 |
| Skills mismatch, range of countries | About 40% in Greece and Chile, under 20% in Sweden and the United States1 | 2011-12 |
| Literacy mismatch, pooled survey | 86% well matched, 4% under-skilled, 10% over-skilled2 | PIAAC first wave, 2013 paper |
| Qualification mismatch, OECD average | A third of workers4 | 2019 |
| Qualification mismatch, highest | More than half of workers in South Africa and Mexico, mostly over-qualification4 | 2019 |
| Qualification mismatch, lowest | Under a quarter in the Czech Republic, Slovak Republic, Hungary, Poland and Slovenia4 | 2019 |
Worked example (our arithmetic). Take 1,000 workers in a country at the OECD average for 2011-12. A 25% mismatch means 250 workers are mismatched1. With 18% over-skilled and 7% under-skilled, that splits into 180 over-skilled and 70 under-skilled1. The 180 and 70 add to the 250, and 180 divided by 70 is about 2.6, close to the paper’s “roughly two and a half times”1.
| Group in 1,000 workers | Share | Workers |
|---|---|---|
| Over-skilled | 18%1 | 180 |
| Under-skilled | 7%1 | 70 |
| Mismatched in total | 25%1 | 250 |
Over-skilling is the common case: across OECD countries it is on average roughly two and a half times as common as under-skilling1. On the 2013 paper’s measure, over-skilling can affect as many as 18% of workers in Austria and as few as 6.4% in Finland2.
Why 25% and 14% are both right
The two OECD figures for literacy and for all skills come from the same family of surveys, and still differ. The 2017 paper reports 25% on average1. The 2013 paper measures literacy alone, and finds 86% of dependent employees well matched, 4% under-skilled and 10% over-skilled, which is a 14% mismatch by our addition, 4 + 102. The overlap between the domains is large: 94% of the workers well matched in literacy are also well matched in numeracy2. The gap between 14% and 25% comes from what is counted, not from different workers. Neither is an error.
Mismatch is not idle talent
The 2013 paper checks whether the label means anything by looking at what workers do. Over-skilled workers appear to use their skills at work less than similarly proficient, well-matched workers: 14.4% less literacy and 6.0% less numeracy2. Under-skilled workers use their literacy about 25.9% more than well-matched peers2. The measure therefore tracks real differences in skill use. It also finds that approximately 8% of workers above the age of 40 are over-skilled, and the author suggests that improving the matching of older workers may help mitigate the impact of population ageing on productivity2.
Shortages and surpluses: the market view
The Skills for Jobs database asks a different question: which skills are scarce in the whole labour market? Some degree of skill imbalance is inevitable, because technological developments continuously change skill demand4. Persistent imbalances may be the symptom of labour markets functioning sub-optimally4. The 2022 edition finds a clear pattern.
| Skill group | Direction across OECD countries |
|---|---|
| Medical knowledge | Large and increasing shortage for the past eight years4 |
| Training and education skills | Large and increasing shortage for the past eight years4 |
| Business processes and resource management | Increasingly in surplus4 |
| Physical skills, production and technology knowledge | Persistently in surplus4 |
| Cognitive skills and digital skills | Shortages relatively small or in balance on average across 43 countries4 |
The last row is easy to misread. Digital and cognitive skills are in high demand, yet the shortage is small, which suggests supply is keeping up on average4. The OECD’s own reading is that rising demand for social, cognitive and digital skills does not need to become a shortage if supply keeps up4. The reverse side matters for workers: people holding surplus skills may need to strengthen other skills to remain employable or improve their wages4.
Where do shortages sit by skill level? In Belgium, Estonia and Finland, more than 80% of employment in shortage occupations is highly skilled4. Across OECD countries, 41% of employment in hard-to-fill jobs is in medium-skilled occupations, and in Mexico, the United States and Austria that share exceeds 50%4. Less than 10% of OECD shortage employment is in low-skilled occupations, but about a third in non-OECD countries such as Bulgaria, Romania and Argentina4.
What does skills mismatch cost?
Three parties pay. For workers, the ILO statistics department lists lower wages for the over-qualified, lower job satisfaction and a higher risk of being out of employment5. For employers, lost productivity, lower growth and higher training cost5. For society, sunk education costs, higher unemployment benefits and lost income tax revenues5. Qualification mismatch signifies poor utilization of human capital5.
The wage numbers are specific. In OECD countries, over-qualification carries an average wage penalty of 14 percent, while field-of-study mismatch carries no significant penalty5. The distinction matters: studying the “wrong” subject costs little on average, but working below your level costs a lot5.
At the economy level, the OECD finds higher skills mismatch associated with lower labour productivity, with over-skilling particularly costly1. Italy, a country with high skills mismatch and low allocative efficiency, could raise labour productivity by around 10% if it cut mismatch within each industry to OECD best practice1. For New Zealand the paper associates best-practice allocation of skills with an increase in productivity of around 7%1. The mechanism is reallocation: skilled labour can be clogged up in low-productivity firms1. From the angle of a single firm, hiring an over-skilled worker may be beneficial for productivity, which is why the cost is easy to miss firm by firm and shows up only in industry and country totals1. France’s productivity board also proposed skills mismatch as a potential explanation for the slowdown in French productivity3.
These are counterfactuals, not forecasts: they show what the estimated relationship implies if mismatch fell to best practice within each industry1.
What reduces it?
Education is the obvious lever, but the evidence is wider. Skills mismatch is found to be lower in countries with well-designed framework conditions that promote efficient reallocation, and housing policies that do not impede residential mobility1. Differences in mismatch across countries are associated with differences in the policy environment1. Strict bankruptcy law can trap high-skilled workers in inefficient firms and jobs that are not sufficiently challenging1. The paper’s reading is that policy should focus on factors that impose frictions on the efficient reallocation of labour1.
On the supply side, the Skills for Jobs report recommends responsive adult learning policies that enable people to upskill and reskill continuously4. It calls career guidance for adults a fundamental policy lever, to motivate adults to train and steer choices toward growing and emerging occupations and skills4. It adds that country- or region-specific exercises are needed to anticipate future skill needs4.
Employers are already moving. Skill gaps are the biggest barrier to business transformation, cited by 63% of employers in the World Economic Forum’s 2025 survey, and 85% plan to prioritize upskilling7. Of 100 workers, the survey’s employers expect 59 to need training by 2030, with 29 upskilled in their current roles, 19 redeployed within the organization and 11 unlikely to receive it7. Funding for and provision of reskilling are the two most welcomed public policies for raising talent availability7. The same survey expects 39% of existing skill sets to be transformed or outdated over 2025 to 20307. See the automation guide for what employers forecast about jobs themselves.
Skills mismatch in the GTCI
The Global Talent Competitiveness Index measures a version of this under Vocational and Technical Skills. The 2017 edition added an Employability sub-pillar measuring the extent of skill gaps and labour market mismatches in each country8. Employability is measured by indicators of skills gaps and labour market mismatches and by the adequacy of educational systems8. The 2017 report also named the skills-gap paradox that earlier editions had highlighted: millions of unemployed people, notably youth, while millions of jobs go vacant for lack of the skills to fill them8. For where the sub-pillar sits in the model, see what the index measures and the six pillars.
The rankings give concrete cases, each with its edition year.
| Edition | Country | Result |
|---|---|---|
| GTCI 2017 | Finland, 9th overall | First in the Employability sub-pillar8 |
| GTCI 2025 | Japan, 26th overall | 66th in Vocational and Technical Skills and 118th in Employability, a weaker alignment between education and labour demand9 |
| GTCI 2025 | United Arab Emirates | 6th for employability and 7th for education relevance9 |
The 2025 edition also shows a limit of the measure. Only two indicators correlate weakly with their aggregates, and one of them is “ease of finding skilled employees”9. The lowest correlation of any sub-pillar to its pillar is 0.82, between Employability and its pillar9. A country can therefore rank well on the headline index and poorly on employability, as Japan does9.
How to read a mismatch statistic
- Which term? Skill, qualification, field of study, or shortage. They are not interchangeable, and a qualification mismatch does not always imply a skills mismatch4.
- Which survey and year? PIAAC first-wave figures date from 2011-121. Qualification data in the 2022 Skills for Jobs report date from 20194.
- Over or under? Over-skilling dominates the first-wave figures1.
- What is the benchmark? Over-qualified relative to the modal attainment in the occupation, not to a legal minimum4.
- Is it a cost estimate or a correlation? The productivity figures are counterfactuals from estimated relationships, not forecasts1.
Editor’s verdict
Skills mismatch is real, common and measurable, and quoted numbers span a wide range because the yardsticks differ. For the first-wave OECD survey, one worker in four was mismatched, and the typical case was a worker with more skill than the job used1. The strongest evidence on cost is that over-qualification carries a wage penalty of 14 percent5 and that mismatch is associated with lower productivity1. The strongest evidence on cure points beyond classrooms to the rules that let labour and firms reallocate1. What the sources do not support is a single global mismatch rate, or the idea that a skills shortage and a skills mismatch are the same thing.
Read next
Talent and technology
How many jobs will automation replace? Studies compared
Estimates run from 9% to 47% of jobs, from 85 million displaced to 170 million created. Why Oxford, OECD, ILO and WEF disagree, and which jobs sit where.
How the index works
GTCI pillars: Enable, Attract, Grow, Retain, VT and GA
What each of the six Global Talent Competitiveness Index pillars measures, which sub-pillars and indicators sit under it and who led it in 2025.
How the index works
What is the Global Talent Competitiveness Index (GTCI)?
What the GTCI talent ranking measures, how its six pillars and 0 to 100 scores are built, who publishes it and how it differs from other rankings.
Sources
- Skills mismatch, productivity and policies: Evidence from the second wave of PIAAC (Economics Department Working Paper 1403) · OECD, Adalet McGowan and Andrews, 2017 · oecd.org · checked October 21, 2026
- A New Measure of Skills Mismatch: Theory and Evidence from the Survey of Adult Skills (PIAAC) · OECD, 2013 · oecd.org · checked October 21, 2026
- A new approach to skills mismatch · OECD, Brun-Schammé and Rey, 2021 · oecd.org · checked October 21, 2026
- Skills for Jobs 2022: Key Insights · OECD Skills for Jobs database, 2022 · oecdskillsforjobsdatabase.org · checked October 21, 2026
- Qualification and Skill Mismatch: Concepts and Measurement · International Labour Organization, Department of Statistics (Valentina Stoevska) · oitcinterfor.org · checked October 21, 2026
- Exploring skills mismatches (ILO Skills for Jobs Database) · International Labour Organization, 3 January 2022 · ilo.org · checked October 21, 2026
- Future of Jobs Report 2025 · World Economic Forum, January 2025 · www3.weforum.org · checked October 21, 2026
- The Global Talent Competitiveness Index 2017: Talent and technology · INSEAD, Adecco Group and HCLI, GTCI 2017 · globaltalentcompetitivenessindex.org · checked October 21, 2026
- Global Talent Competitiveness Index 2025: Talent and resilience · INSEAD and Portulans Institute, GTCI 2025 · portulansinstitute.org · checked October 21, 2026
Image credits (2)
Published . Rankings change with every edition: each figure names its edition year and each source shows the day it was checked. How we check facts · Report an error.